Workflow automation statistics: adoption, performance, and ROI [2025]
Automation platforms span RPA, no-code builders, and API orchestration. Teams automate payment runs, approvals, onboarding, provisioning, and campaign operations.
Companies report five-figure annual cost reductions and strong first-year ROI. Maturity varies, with only a small share reaching hands-free operations. Programs with clear KPIs, governance, and measurement scale best.
The data below shows where adoption is highest, which metrics move most, and how to operationalize programs with clear KPIs, ownership, and guardrails.
Stats at a glance
60%
U.S. companies using automation
4%
fully hands-free operations
500+ hrs
annual finance time saved
$46k
avg savings per year
30–200%
first-year ROI range
Overview table: how organizations apply workflow automation
| Plan | Best For | Key Strength | Drawbacks | Pricing |
|---|---|---|---|---|
| RPA scripts | High-volume, rule-based tasks | Fast deployment on legacy UIs | Fragile if interfaces change | Per bot license |
| No-code automation | Business-led task automation | Quick wins and flexible triggers | Shadow IT risk without governance | Subscription tiers |
| API orchestration | Data and system workflows | Scalable, reliable, easier to test | Requires developer time | Custom |
| End-to-end process automation | Multi-step cross-team chains | Compliance, auditability, resilience | Longer build and change management | Enterprise platform |
| Automation center of excellence | Scaling across functions | Standards, reuse, portfolio tracking | Upfront investment in tooling and talent | Blended OpEx and CapEx |
What should business leaders do with these statistics?
The data shows mainstream adoption with clear time and cost outcomes, and a gap in measurement at scale. Leaders should normalize automation as core infrastructure and track value as a standard operating metric.
➡️ Set quarterly adoption and value targets by function.
Put one production automation in finance or IT and one in HR or marketing within 90 days.
➡️ Prioritize measurable workflows.
Target processes tied to hours saved, cycle time, error rate, and rework cost.
➡️ Publish an automation scorecard.
Report usage, run success rate, exceptions, time saved, dollars saved, and incidents.
➡️ Build the governance and data layer.
Define connectors, secrets management, logging, redaction, and access controls.
➡️ Train, instrument, and iterate.
Create playbooks and QA rituals, maintain change logs, and review failures weekly.
💡 Takeaway: Treat automation as an enterprise capability. Launch targeted workflows, measure relentlessly, and scale only when reliability and safety
Reality check: Why some AI rollouts don’t deliver ROI
Despite widespread AI adoption (78% of companies, up from 55% in 2023), The Wall Street Journal reports a "productivity paradox."
Many organizations see minimal financial returns → under 10% cost savings and below 5% revenue gains. Only 1% of U.S. companies have successfully scaled AI beyond pilot phases. Experts suggest a task-based approach, aligning AI with KPIs, and ensuring robust data infrastructure for success.
Source: wsj.com
What does this mean for business leaders?
➡️ Start with specific, quantifiable tasks. Avoid sweeping AI initiatives that lack measurable outcomes. Begin by identifying high-frequency, repeatable workflows where AI can be measured against clear KPIs.
➡️ Prioritize scale, not scope. Many organizations stall at piecemeal pilots. Governance bodies, data strategy, and cross-department orchestration are essential to scale successfully.
➡️ Measure productivity, not hype. Early AI gains often come from efficiency—not broad transformation. Be realistic: small gains in time saved or error reduction can compound into significant ROI.
➡️ Build infrastructure before investing. Without harmonized data systems and common definitions, pilots stall. Investing in unified data infrastructure pays dividends before scaling AI.
30+ statistics you need to know about (in categories)
Adoption trends
TL;DR → Adoption is broad, maturity is mixed. Most organizations use automation in some workflows.
Few have fully autonomous operations. Large enterprises prioritize hyperautomation, while SMEs report higher success rates and intent to invest.
- 60 percent of U.S. companies report using automation tools in workflows
- Only 4 percent of businesses have fully automated hands-free operations
- 90 percent of large enterprises prioritize hyperautomation, fewer than 20 percent measure impact effectively
- 65 percent of SMEs report successful automation outcomes vs 55 percent of large enterprises
- Over 90 percent of small businesses are considering AI-driven automation tools to stay competitive
💡 Takeaway: Make maturity explicit. Place each workflow on a ladder from manual to assisted to orchestrated to autonomous, and set quarterly goals to climb one step per priority process.
Data sources: Duke University, Formstack, Gartner, McKinsey, Visa
Time and cost savings
TL;DR → Automation saves hundreds of hours per team annually, reduces manual work costs, and delivers strong first-year ROI. Intelligent and hyperautomation produce larger savings than basic task automation.
- Automating payment processes saves 500+ hours per year in finance teams
- Companies report an average of $46,000 per year saved from fewer errors and less manual work
- Basic automation reduces cost 20 to 30 percent, intelligent automation delivers 50 to 70 percent
- Hyperautomation can cut operating costs by up to 30 percent in mature programs
- First-year ROI ranges 30 to 200 percent depending on scope and process mix
💡 Takeaway: Build a unit economics model per workflow. Track cycle time, exception rate, rework, and labor hours before and after. Use these deltas to prioritize the next automations.
Data sources: American Express, Formstack, McKinsey, Gartner, ProfileTree
Business process and departmental use cases
TL;DR → High-value automations exist in every function. Marketing, finance, HR, supply chain, and IT show clear patterns with measurable outcomes.
- In marketing, 58 percent automated email, 49 percent social posting, 33 percent content management
- In finance, up to 80 percent of transactional tasks are automatable with current tools
- HR automation has grown 599 percent; AI HR bots now handle 39 percent of employee service interactions
- In operations, 70 percent of professionals say automation improved retention, and over half see upskilling and new job creation
- In IT, 70 percent of organizations will use structured rules-based automation by 2025, up from 20 percent in 2021
💡 Takeaway: Map five end-to-end processes that span multiple teams, then automate the highest error or cycle-time segment first. Expand outward as reliability and savings are proven.
Data sources: Statista, Accenture, SHRM, Vecna Robotics, Gartner
Employee productivity and satisfaction
TL;DR → Employees report faster work, higher satisfaction, and less burnout with automation. Quality improves as data entry mistakes drop.
- 74 percent of U.S. employees say automation helps them get work done faster
- 89 percent report higher job satisfaction and 84 percent higher company satisfaction with automation in place
- 90 percent of knowledge workers say automation improved their jobs by removing tedious tasks
- Automation can eliminate up to 90 percent of manual data entry errors in standardized processes
- 29 percent of small business owners prioritize automation to reduce burnout and long hours
💡 Takeaway: Treat employee experience as a KPI. Pair automation launches with workload and morale surveys, and use exception queues to keep people focused on higher-value work.
Data sources: Salesforce, Zapier, Grand View Research, Incfile
Tools, platforms, and investment
TL;DR → Software spend is rising, low-code is mainstreaming, and RPA remains cost-efficient compared with labor. Finance leaders are budgeting accordingly.
- Workflow automation software market valued around $20 billion in 2023, projected $80.9 billion by 2030 at 23.5 percent CAGR
- Marketing automation platforms expected to grow from $5.65 billion in 2024 to $14.55 billion by 2031 at roughly 12.5 percent CAGR
- By 2025, 75 percent of application development will use low-code platforms
- Software robots cost about one-third of an offshore FTE and one-fifth of an onshore FTE for equivalent work
- 58 percent of CFOs are allocating more budget to technology and automation than the prior year
💡 Takeaway: Create a three-year investment plan that balances licenses, cloud usage, integration, monitoring, and enablement. Use shared platforms and templates to reduce duplicate spend.
Data sources: Emergen Research, Verified Market Research, Forrester, IBM, PwC
Final thoughts
Organizations are standardizing on automation for finance, HR, IT, and marketing, with measurable gains in time, cost, and quality. The fastest progress comes from launching targeted workflows, instrumenting value, and scaling under clear governance. Teams that operationalize automation across functions will lead on speed, accuracy, and cost to serve.
Implementation roadmap
- Define goals and KPIs
Select one cost metric and one productivity or quality metric for each workflow. Set a 90-day review.
- Select use cases by maturity
Start with one finance or IT automation and one HR or marketing automation with clear baselines.
- Prep data and access
Map systems, credentials, permissions, and retention. Prefer APIs and vetted connectors.
- Pilot and evaluate
Run phased rollouts with holdouts. Track adoption, failures, rework, and savings. Review weekly.
- Govern and scale
Create playbooks, naming and versioning standards, logging, and monitoring. Expand to adjacent processes.
FAQ: workflow automation 2024–2025
Where should teams start with automation?
Begin with high-volume, low-exception tasks in finance or IT and one customer-facing workflow in marketing or support. Measure before and after.
How should ROI be measured?
Track hours saved, cycle time reduction, error reduction, rework avoided, and cost per transaction. Use holdouts or phased rollouts for causal impact.
How do we keep automations reliable?
Favor APIs over UI bots, add monitoring and alerts, maintain exception queues, and budget time for maintenance.
How should governance work?
Define owners, policies, secrets handling, logging, and change control. Maintain a portfolio and retire brittle automations.
What are the main risks?
Fragility from UI changes, shadow IT, and privacy issues. Mitigate with platform standards, access controls, and regular audits.
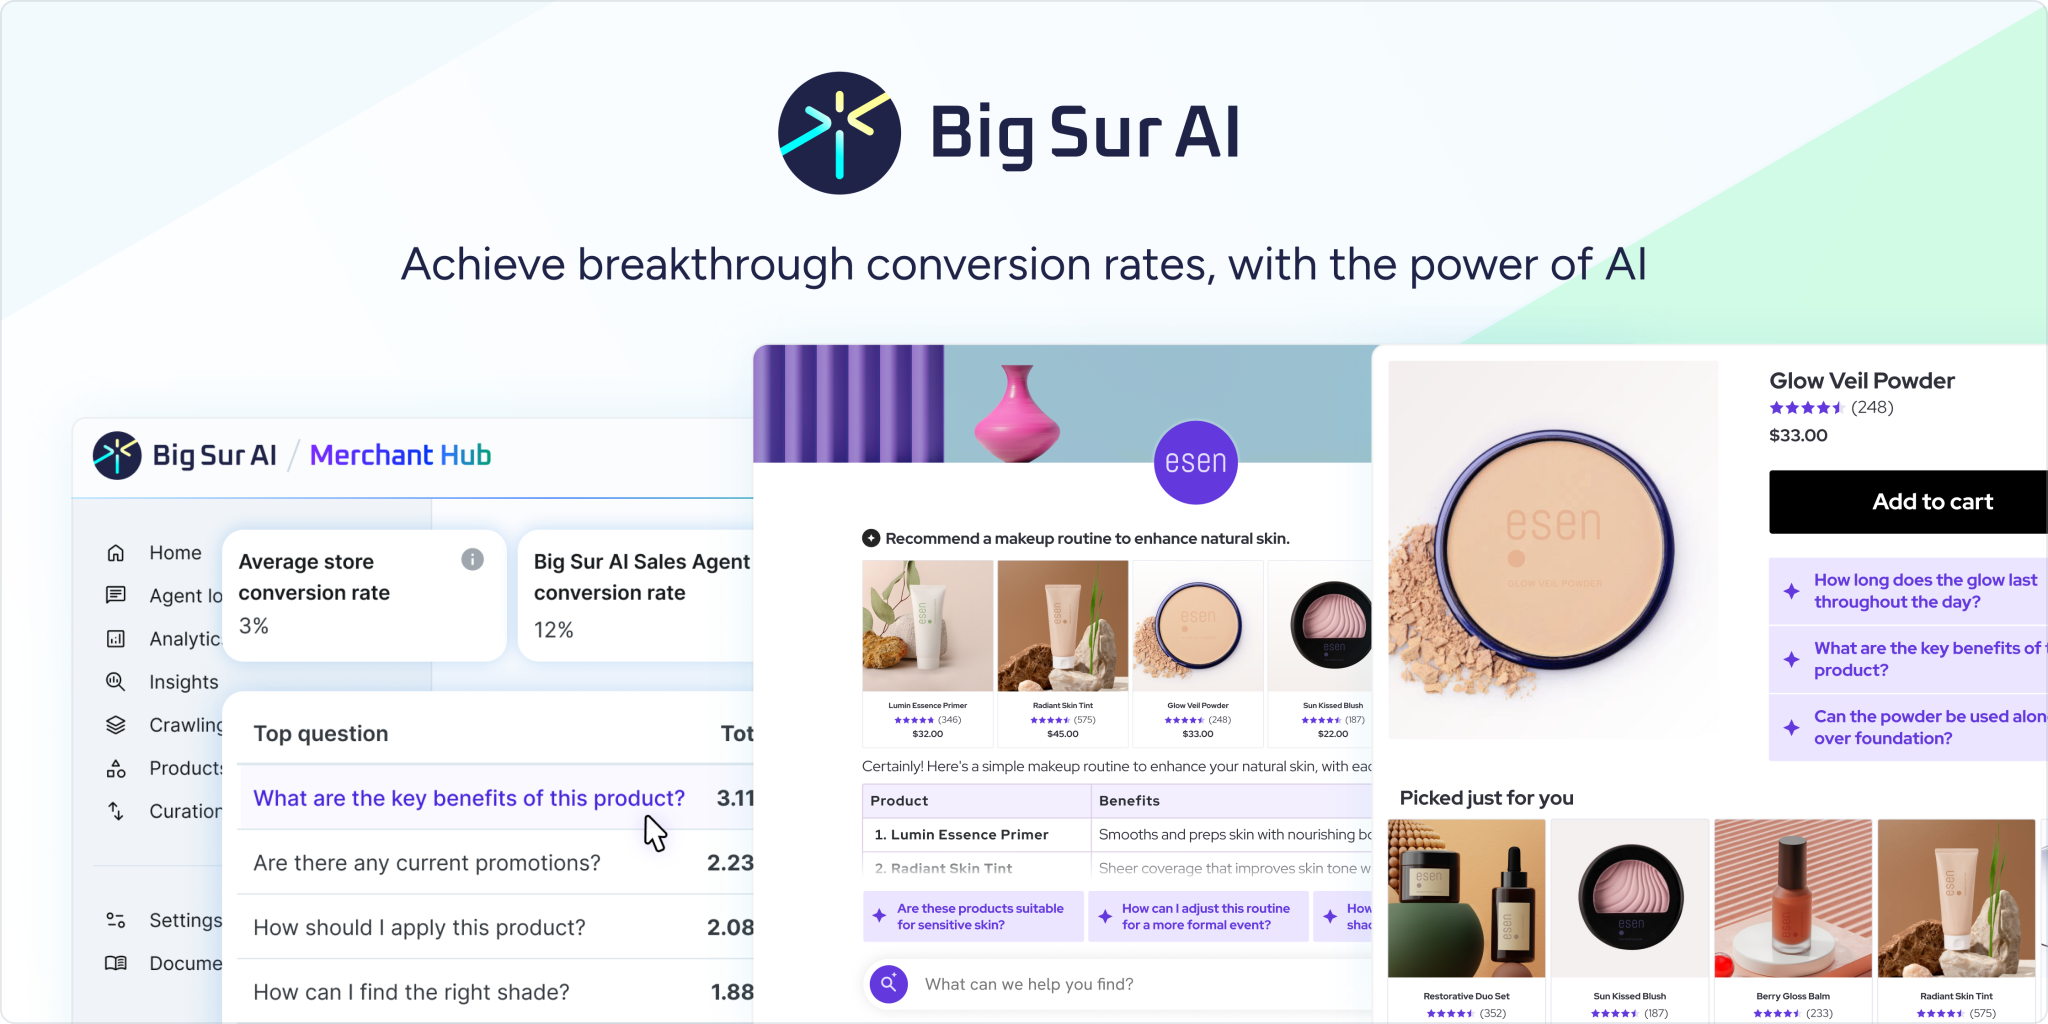
Need an AI chatbot that converts website visitors?
Big Sur AI (that’s us 👋) is an AI-first chatbot assistant, personalization engine, and content marketer for websites.
Designed as AI-native from the ground up, our agents deliver deep personalization by syncing your website’s unique content and proprietary data in real time.
They interact naturally with visitors anywhere on your site, providing relevant, helpful answers that guide users toward their goals → whether that’s making a decision, finding information, or completing an action.
All you need to do is type in your URL, and your AI agent can be live in under 5 minutes ⤵️
Here’s how to give it a try:
- Sign up on Big Sur AI's Hub (link here).
- Enter your website URL. Big Sur AI will automatically analyze your site content.
- Customize your AI agent. Set up specific AI actions and decide where the AI agent will appear on your site.
- Launch and monitor. Your AI agent will be live in minutes, and you can track performance with real-time analytics.
Try Big Sur AI on your site in minutes by clicking the image below 👇