[Top 5] Analytics & Monitoring Tools for AI Chatbots in 2025
Want the best analytics and monitoring tools for AI chatbots, LLM apps, or product analytics?
This guide breaks down the top options (Humanloop, GA4, Amplitude, Trulens, and PostHog) so you can pick the right tool for your real-world needs.
Below, you’ll get concise, side-by-side comparisons focused on features that matter most: real-time visibility, actionable alerts, open-source vs. proprietary control, product analytics depth, and pricing transparency.
Every tool is rated with clear pros and cons, tips on hidden pitfalls, what makes each tool uniquely strong, and honest limitations, based on user reviews and hard adoption data.
Here’s the TL;DR 👇
| Tool | Best For | Key Strength | Drawbacks | Pricing |
|---|---|---|---|---|
| Humanloop | LLM product teams, AI/ML engineers needing real-time LLM app monitoring |
Unified LLM ops stack: real-time tracing, prompt versioning, evaluations, A/B testing, user feedback | Closed-source; limited self-hosting; not OpenTelemetry-native; prompt repo not Git-native |
No public pricing; sales-quoted by usage, seats, support; free trial with usage limits |
| Google Analytics 4 | Digital marketers, website/app owners, analysts |
Robust event-based tracking with cross-platform analytics, Google Ads/linking, and BigQuery export |
Cardinality/threshold limits; UI data retention (2–14 mo); advanced analysis often needs BigQuery/SQL |
Standard: Free; Analytics 360: custom quote; BigQuery billed separately |
| Amplitude | Product managers, growth/data teams needing granular product analytics |
Deep event/funnel/cohort analytics, activation/retention metrics, audience export and behavioral targeting |
Volume-based & add-on pricing; heavy instrumentation & setup; closed query model limits joins |
Free tier; Growth/Enterprise: custom quote; add-ons priced separately |
| Trulens | AI devs, data science, LLM app monitoring (esp. open-source, RAG, evaluation chains) |
Open-source LLM observability; deep tracing; groundedness/attribution; A/B evals; live dashboards |
Evaluator calibration needed; limited integrations; tracing/storage overhead at scale |
Open-source core free; hosted/enterprise custom (not listed); infra & LLM API costs extra |
Key Summary of Differences
- Humanloop: Best for commercial LLM teams needing unified monitoring, traceability, and fast feedback; proprietary, feature-rich but costs can scale.
- Google Analytics 4: Best for digital/web and marketing analytics; free for standard usage; strong integrations with Google ecosystem.
- Amplitude: Advanced product analytics for digital products, focused on event funnels/cohorts; powerful but can get expensive.
- Trulens: Open-source, deeply transparent, and customizable for LLM/RAG pipelines; great for engineering/data science teams valuing OSS.
Non-obvious things to look for in analytics & monitoring tools
Factor 1: Data freshness and real-time gaps
Many tools claim to be "real-time," but some have hidden lag in reporting or refresh cycles. Users on r/analytics mention issues with data delays during peak hours, especially for larger datasets. It’s crucial to test latency in your actual use case or ask for benchmarks.
"Even on their 'real-time' dashboard, we only saw updates every 10-15 minutes," shared one YouTube reviewer.
Factor 2: Openness and integration agility
Flexibility to ingest and export from a wide range of sources is often much patchier than platforms advertise. On G2, buyers report headaches integrating with niche databases or bespoke data workflows.
Check API documentation and look for no-code/low-code connector options before committing.
✔️ One comment: "Slick UI but limited connectors—took our devs days to hack around."
Factor 3: Vendor transparency & support culture
Many platforms have strong onboarding but limited long-term transparency in pricing, security, or product roadmap.
Look for responses to critical social media posts and look for specific examples of prompt, knowledgeable support.
A Slack or Discord community can signal a more open culture. Review: "Support was super fast at first, but after six months, responses dropped off the map."
💡 Honorable mentions: Alert management customization, privacy compliance, and total cost of ownership are also key for advanced buyers.
The Best Analytics & Monitoring Tools in 2025
Google Analytics 4
Public reviews: 4.4 ⭐ (G2, Capterra average)
Our rating: 8.5/10 ⭐
Similar to: Adobe Analytics, Matomo
Typical users: Digital marketers, website owners, analysts
Known for: Robust event-based tracking and deep integration with other Google products
Why choose it? Powerful free option with advanced insights, flexible reporting, and future-proof measurement for evolving web and app environments
What is Google Analytics 4?
GA4 is Google’s event-based analytics for web and app.
It unifies user journeys, tracks events, funnels and cohorts, and ties to Google Ads.
Export raw data to BigQuery, use consent mode, and prep for cookie loss with modeled attribution.
Why is Google Analytics 4 a top analytics & monitoring tool?
Event-based tracking across web and app, tight Google Ads link, built-in BigQuery export, consent mode, and modeled attribution deliver clear journeys and flexible reports for free.
Google Analytics 4's top features
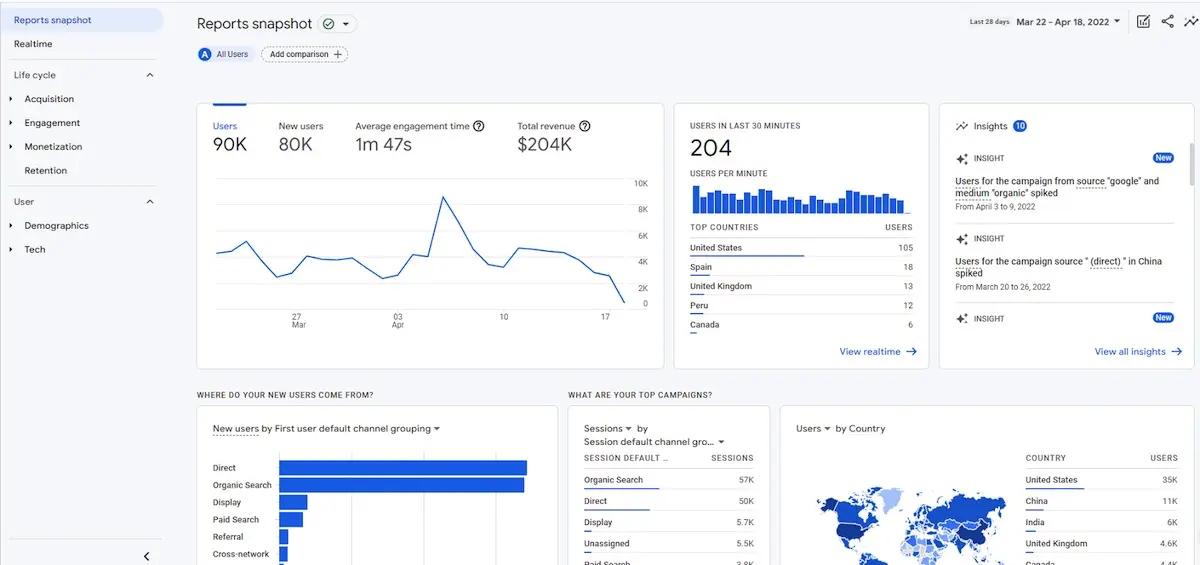
- Event-based tracking and enhanced measurement: Captures interactions as events with parameters across web and app; automatically records page views, scrolls, outbound clicks, file downloads, site search, and video engagement; supports custom events and parameters.
- Cross-platform user and identity framework: Combines web and app data using User-ID and device signals to stitch sessions and events under a single user where available, enabling user-level and device-level reporting.
- Explorations (funnels, paths, cohorts, segments): Provides an analysis workspace to build free-form tables and charts; constructs open/closed funnels, pathing from any event node, cohort analyses, and segment overlap; saves segments and audiences for reuse.
- BigQuery export of raw events: Sends unsampled, event-level data to Google BigQuery with user, event, and item tables, allowing SQL querying and joins with other datasets.
- Real-time reports and DebugView: Streams recent events and conversions in real time; shows per-device event timelines and parameter payloads to validate tagging during implementation.
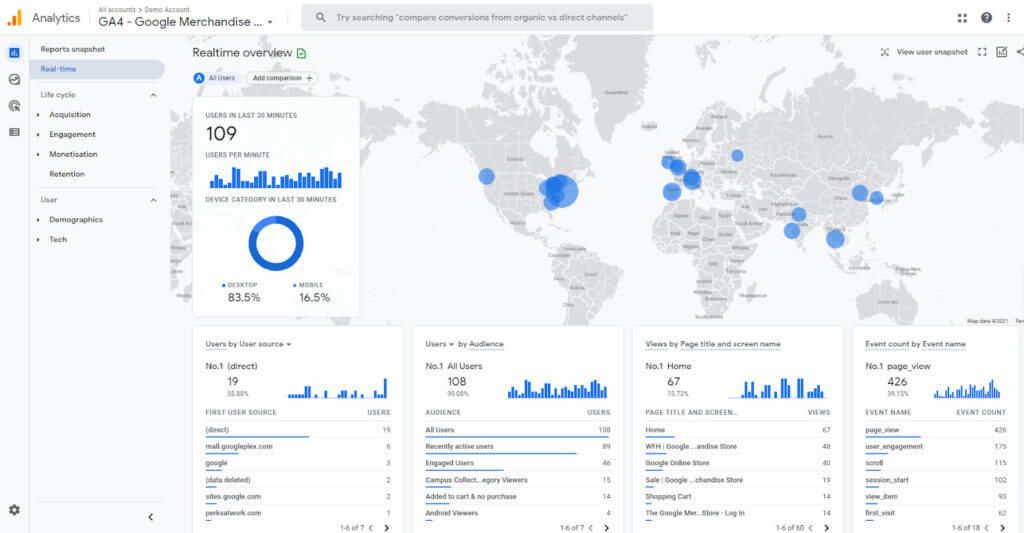
💡 Summary: GA4 captures event-level data across web and app, unifies users, offers deep analysis in Explorations, exports raw data to BigQuery, and provides real-time and debugging views.
Pros and cons of Google Analytics 4
Pros: why do people pick Google Analytics 4 over other analytics & monitoring tools?
✅ BigQuery export of raw events
Unsampled event tables enable SQL analysis, joins, and ML without enterprise spend.
✅ Native Google Ads activation
Direct Ads/CM360 linking powers remarketing, modeled conversions, and media optimization.
✅ Privacy-resilient measurement
Consent Mode + modeled attribution sustain reporting accuracy as third-party cookies fade.
Cons: What do people dislike about Google Analytics 4?
❌ Cardinality and thresholding limits
High-cardinality breakdowns become (other), and privacy thresholds hide granular rows.
❌ Limited retention and history
Free GA4 retains only 2–14 months of user-level data in the UI unless you export to BigQuery.
❌ Heavy BigQuery/SQL dependency
Advanced analysis often needs BigQuery/SQL, adding data-engineering overhead vs in-tool reporting.
Is there data to back Google Analytics 4 as the best Analytics & Monitoring Tool?
56%
of all websites run Google Analytics (W3Techs, 2024)
5–17%
median conversion lift from Enhanced Conversions with GA4–Google Ads linking (Google Ads, 2023)
4.4★
avg public rating across G2 + Capterra (2024)
Pricing: How much does Google Analytics 4 really cost?
Google prices GA4 with a free standard edition and a quote-based Analytics 360 enterprise tier priced by monthly event volume.
Most companies leverage GA4's free tier as it is included in most Google Business Suite subscriptions.
Choose between these 2 plans:
- Google Analytics 4 (standard) - $0, includes core event-based web and app analytics, Google Ads linking, BigQuery export, and real-time/Explorations within standard limits.
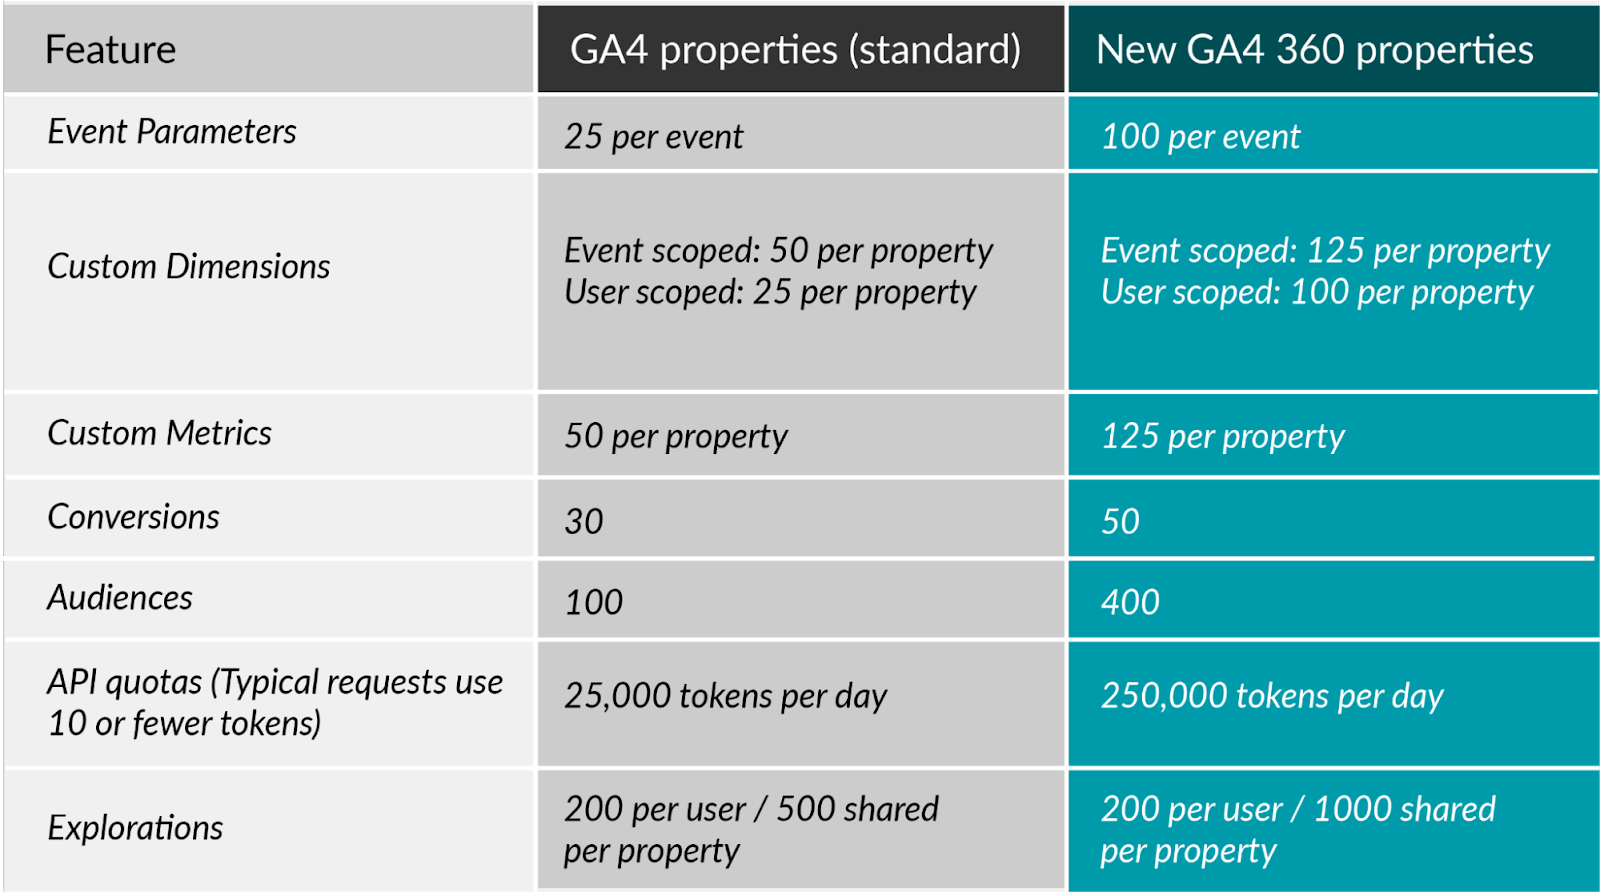
- Analytics 360 - which starts around $150,000 annually or $12,500 monthly- includes higher property and event limits, enterprise governance (subproperties and roll-ups), SLA and support, and expanded quotas and integrations.
Price limitations & potential surprises
(Enteprise) BigQuery export is included but Google Cloud storage and query usage are billed separately, and some enterprise-only features require upgrading to 360.
💡 In short: GA4 is free for most needs, while enterprise scale and governance require a custom-priced 360 contract plus any BigQuery usage fees.
Amplitude
Public reviews: 4.5 ⭐ (G2, Capterra)
Our rating: 8.5/10 ⭐
Similar to: Mixpanel, Heap
Typical users: Product managers, growth and data teams
Known for: Deep product analytics and user behavior insights
Why choose it? Granular tracking, flexible dashboards, and powerful cohort analysis for data-driven product decisions
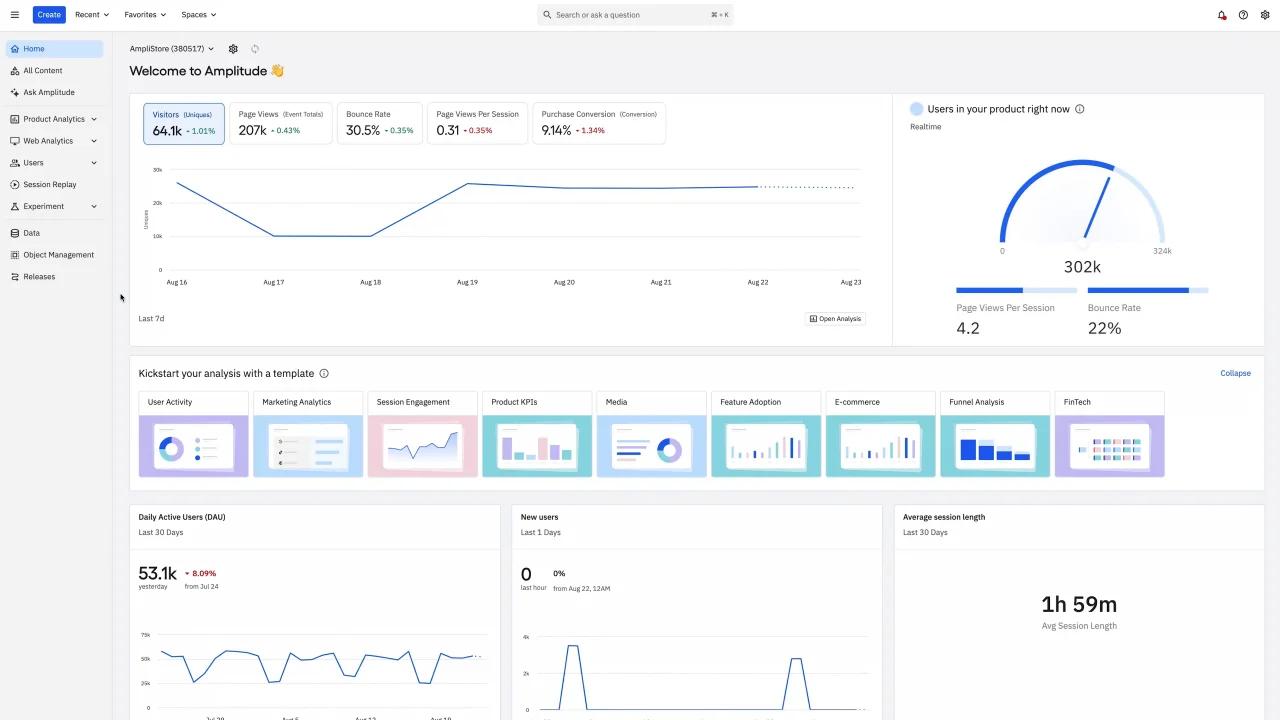
What is Amplitude?
Amplitude is a product analytics platform for event-level tracking. Build funnels, cohorts, retention, pathing, and dashboards; tie revenue to features; run experiments; and sync with your warehouse to drive activation and growth.
Why is Amplitude a top analytics & monitoring tool?
Track key events, build funnels and cohorts, map paths, and measure retention. Tie revenue to features, run A/B tests, and sync with your warehouse to pinpoint what drives activation and growth.
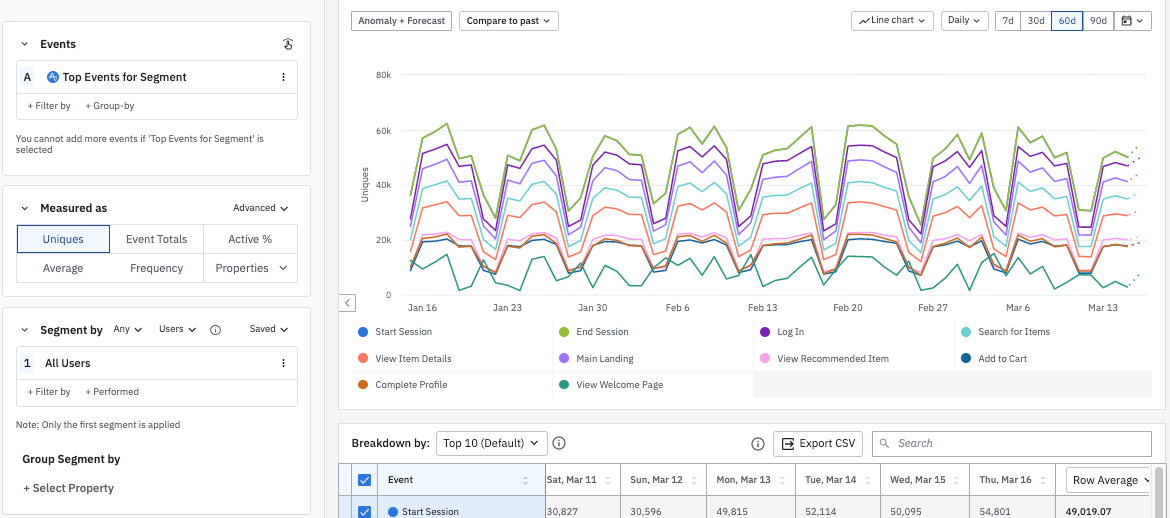
Amplitude's Top Features
- Event-level tracking and identity resolution: Collect event data via web, mobile, and server SDKs; define event and user properties; manage user and session IDs; stitch anonymous and authenticated activity; enforce a central tracking plan and schema governance.
- Event segmentation, charts, and dashboards: Query events over time; filter and group by properties; calculate metrics like counts, uniques, and averages; build custom formulas and comparisons; save charts and organize them into shareable dashboards with scheduled deliveries.
- Funnel analysis: Construct multi-step funnels; choose conversion windows; break down results by properties or cohorts; inspect step-by-step conversion and drop-off.
- Cohorts and audiences: Create behavioral cohorts using sequences, frequency, and recency rules; save and reuse them across analyses; keep them updated automatically; sync cohorts to external destinations.
- Retention analysis: Define start and return events; view cohort tables and retention curves by day, week, or month; segment results by properties or cohorts.
💡 Summary: Amplitude provides event tracking, segmentation, funnels, cohorts, and retention analysis to map and quantify user behavior in digital products.
Pros and cons of Amplitude
Pros: Why do people pick Amplitude over other Analytics & Monitoring Tools?
✅ Event governance and identity resolution
Tracking plans, schema controls, and ID stitching ensure clean, consistent event data at scale.
✅ Behavioral cohorts you can activate
Define complex cohorts and auto-sync them to ads, messaging, and warehouse tools for real-time targeting.
✅ Deep product analytics primitives
Funnels, retention, and pathing surface activation and drop-off drivers faster than generic analytics.
Cons: What do people dislike about Amplitude?
❌ Volume-based pricing and add-on creep
Costs spike with event volume and paid modules (Experiment, CDP), straining larger rollouts.
❌ Heavy instrumentation and upkeep
Implementing a clean tracking plan and taxonomy requires significant upfront work and ongoing maintenance.
❌ Closed query model limits joins
Closed query model limits joins and custom metrics, so complex analysis often moves to the warehouse.
Is there data to back Amplitude as the best Analytics & Monitoring Tool?
119%
dollar-based net retention (DBNRR) — strong customer expansion. Source: Amplitude S-1 (2021)
291%
3-year ROI with <6-month payback from Amplitude Analytics. Source: Forrester TEI (commissioned, 2022)
4.5★
average rating across 1,500+ G2 reviews; consistent Leader in Product Analytics (2023–2024). Source: G2 category reports
Pricing: How much does Amplitude really cost?
Amplitude uses a freemium, usage-based model with discounted annual billing on paid tiers.
Pricing scales primarily by Monthly Tracked Users (MTUs) and product usage.
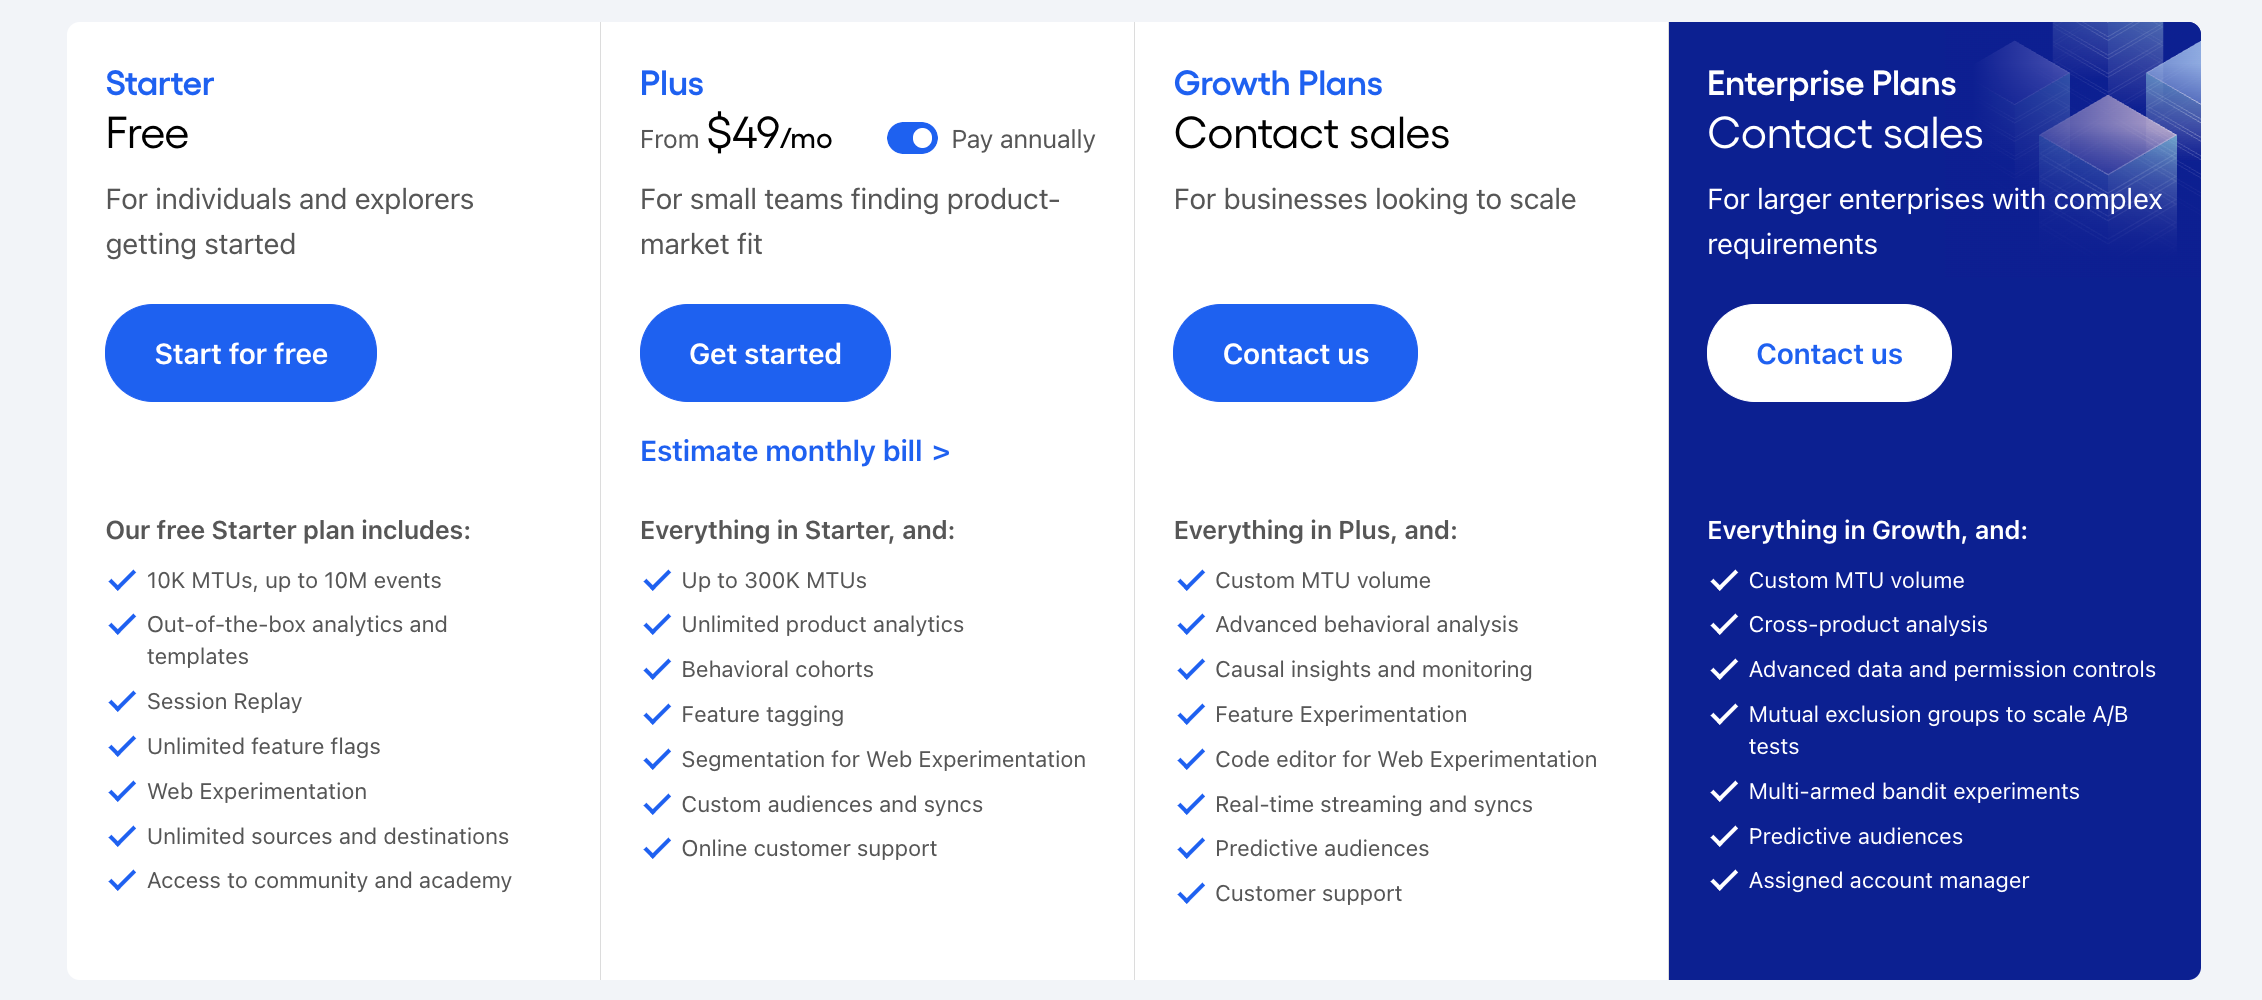
Choose between these 4 plans:
- Starter – Free: $0, for individuals and small projects; includes up to 50K MTUs or 10M events/month, unlimited feature flags, web experimentation, session replay, integrations, and one-year data retention.
- Plus – From $49/month (20% off with annual billing): for growing teams; includes everything in Starter plus behavioral cohorts, feature tagging, custom dashboards, unlimited saved charts, custom audiences and syncs, and email support. Scales up to 300K MTUs.
- Growth – Custom pricing: for scaling organizations; includes all Plus features with advanced behavioral analysis, causal insights, AI summaries, saved metrics, forecasting, guides & surveys, SSO, onboarding support, and unlimited workspaces.
- Enterprise – Custom pricing: for large organizations; includes all Growth features plus cross-product analysis, advanced governance, mutual exclusion groups for experiments, predictive audiences, enterprise-grade security, and a dedicated account manager.
Price limitations & potential surprises
- Fast-growing user bases can quickly increase costs
- Growth plans can reach into the tens of thousands annually ($20K–$250K+ depending on volume).
Trulens
Public reviews: 4.6 ⭐ (G2, producthunt)
Our rating: 8.3/10 ⭐
Similar to: Arize, Wandb
Typical users: AI developers and data science teams
Known for: Open-source evaluation, monitoring, and debugging for LLM-powered apps
Why choose it? Powerful observability for identifying and resolving hallucinations, bias, and drift in AI chatbot performance.
What is Trulens?
Trulens is an open-source observability toolkit for LLM apps. It logs traces, scores outputs with feedback functions, and flags hallucinations, bias, and drift. Run A/B prompt tests, eval chains, and monitor production with live dashboards.
Why is Trulens a top analytics & monitoring tool?
Open-source for LLM apps: logs runs, scores answers, and catches hallucinations, bias, and drift. A/B prompt tests and live dashboards help diagnose and fix issues in production.
Trulens's top features
- Tracing and run logging: Capture every LLM call and chain step, including prompts, responses, tool/function calls, retrieved context chunks, intermediate steps, model/version, token counts, latency, and custom metadata.
- Feedback function library: Apply built-in evaluators (e.g., groundedness, answer relevance, context relevance, toxicity/safety) or custom metrics using LLM-as-judge, embeddings, or rules; record numeric scores and rationales per run.
- A/B testing and experiment comparison: Run batch evaluations across prompts, models, or chain variants on the same datasets; compare side-by-side with score distributions and summary statistics; track experiment versions over time.
- RAG evaluation and attribution: Inspect retrieved documents at the chunk level, link answers to supporting sources, and compute groundedness and context alignment metrics between outputs and retrieved context.
- Dashboards and production monitoring: Explore traces in a web UI, filter by app version or timeframe, visualize metric trends over time, and flag low-scoring or anomalous runs during live traffic.
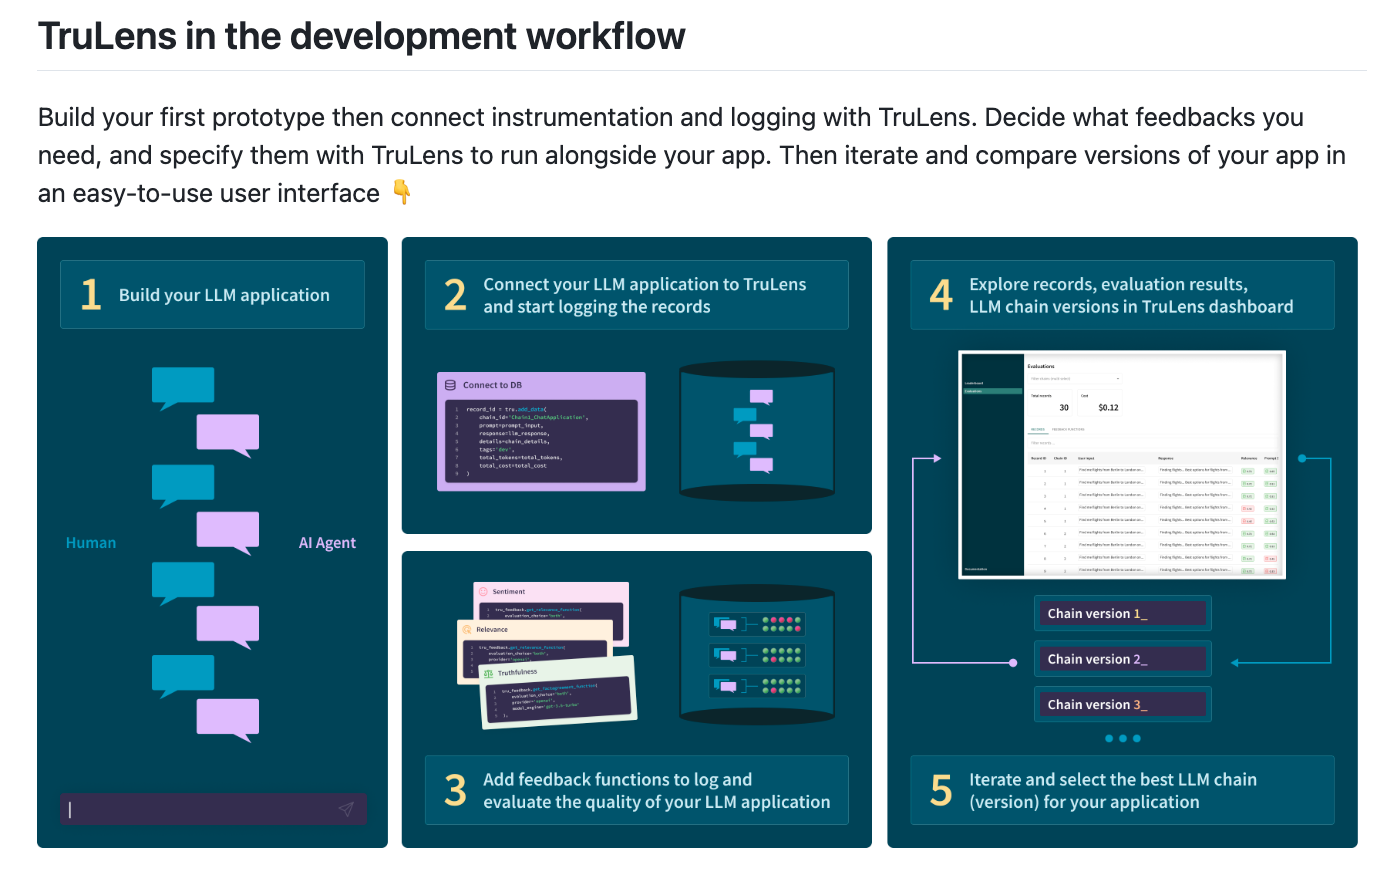
💡 Summary: Trulens logs and traces LLM app runs, scores outputs with built-in evaluators, compares experiments, evaluates RAG pipelines with source attribution, and visualizes metrics in dashboards for ongoing monitoring.
Pros and cons of Trulens
Pros: Why do people pick Trulens over other analytics & monitoring tools?
✅ Open-source, deep tracing
Capture prompts, tool calls, retrieved chunks, tokens, and latency without vendor lock-in.
✅ RAG attribution and groundedness
Link answers to source chunks and score groundedness to pinpoint RAG hallucinations.
✅ Built-in evaluators and A/B testing
Run batch evals with relevance/toxicity metrics and compare prompt/model variants over time.
Cons: What do people dislike about Trulens?
❌ Evaluator noise and calibration
LLM-as-judge scores can drift, needing baselines and spot labels to be reliable in prod.
❌ Limited ecosystem integrations
Fewer native hooks for OpenTelemetry/Datadog and CI, so teams write glue to fit existing stacks.
❌ Tracing overhead at scale
Deep tracing increases latency and storage; sampling/tuning is required for high-traffic workloads.
Is there data to back Trulens as the best Analytics & Monitoring Tool?
4.6/5
Avg public rating (G2 + Product Hunt, Sep 2025). Source: g2.com, producthunt.com
0.8–0.9
Correlation of LLM-as-judge metrics with human labels in peer‑reviewed studies—method used by TruLens evaluators. Sources: arXiv:2303.16634 (G‑Eval), lmsys.org/mtbench
1K+
GitHub stars for TruLens, signaling OSS adoption and community validation. Source: github.com/truera/trulens
Pricing: How much does Trulens really cost?
Trulens' core toolkit is open source and free to use:
- Open source - Free, includes the full OSS library for tracing, feedback evaluators, A/B testing, RAG attribution, and a self-hostable UI for dashboards and monitoring.
Price limitations & potential surprises
There is no managed cloud price on the site, so you will cover your own infrastructure and LLM API costs as usage grows.
Deep tracing can add latency and storage overhead, and if you later need hosted service or enterprise support it will likely be custom and not publicly listed.
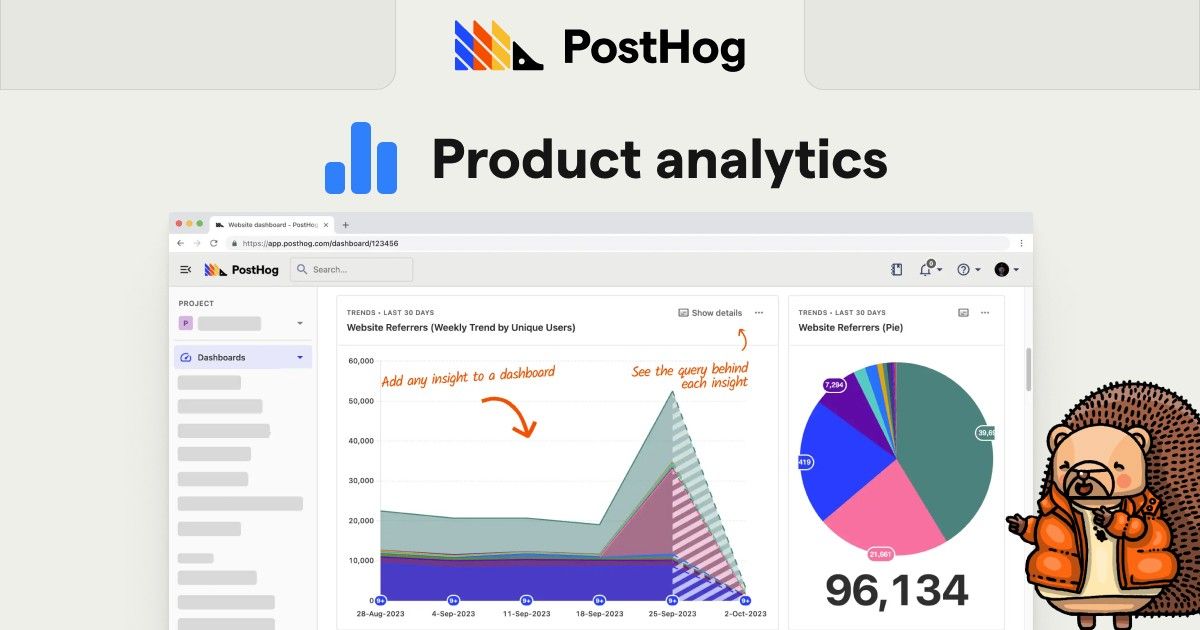
PostHog
Public reviews: 4.6 ⭐ (G2, Capterra average)
Our rating: 8/10 ⭐
Similar to: Mixpanel, Amplitude
Typical users: Product teams, engineers, growth analysts
Known for: Open-source, all-in-one product analytics
Why choose it: Full data ownership, session replay, feature flagging, robust event tracking, and easy self-hosting or cloud options
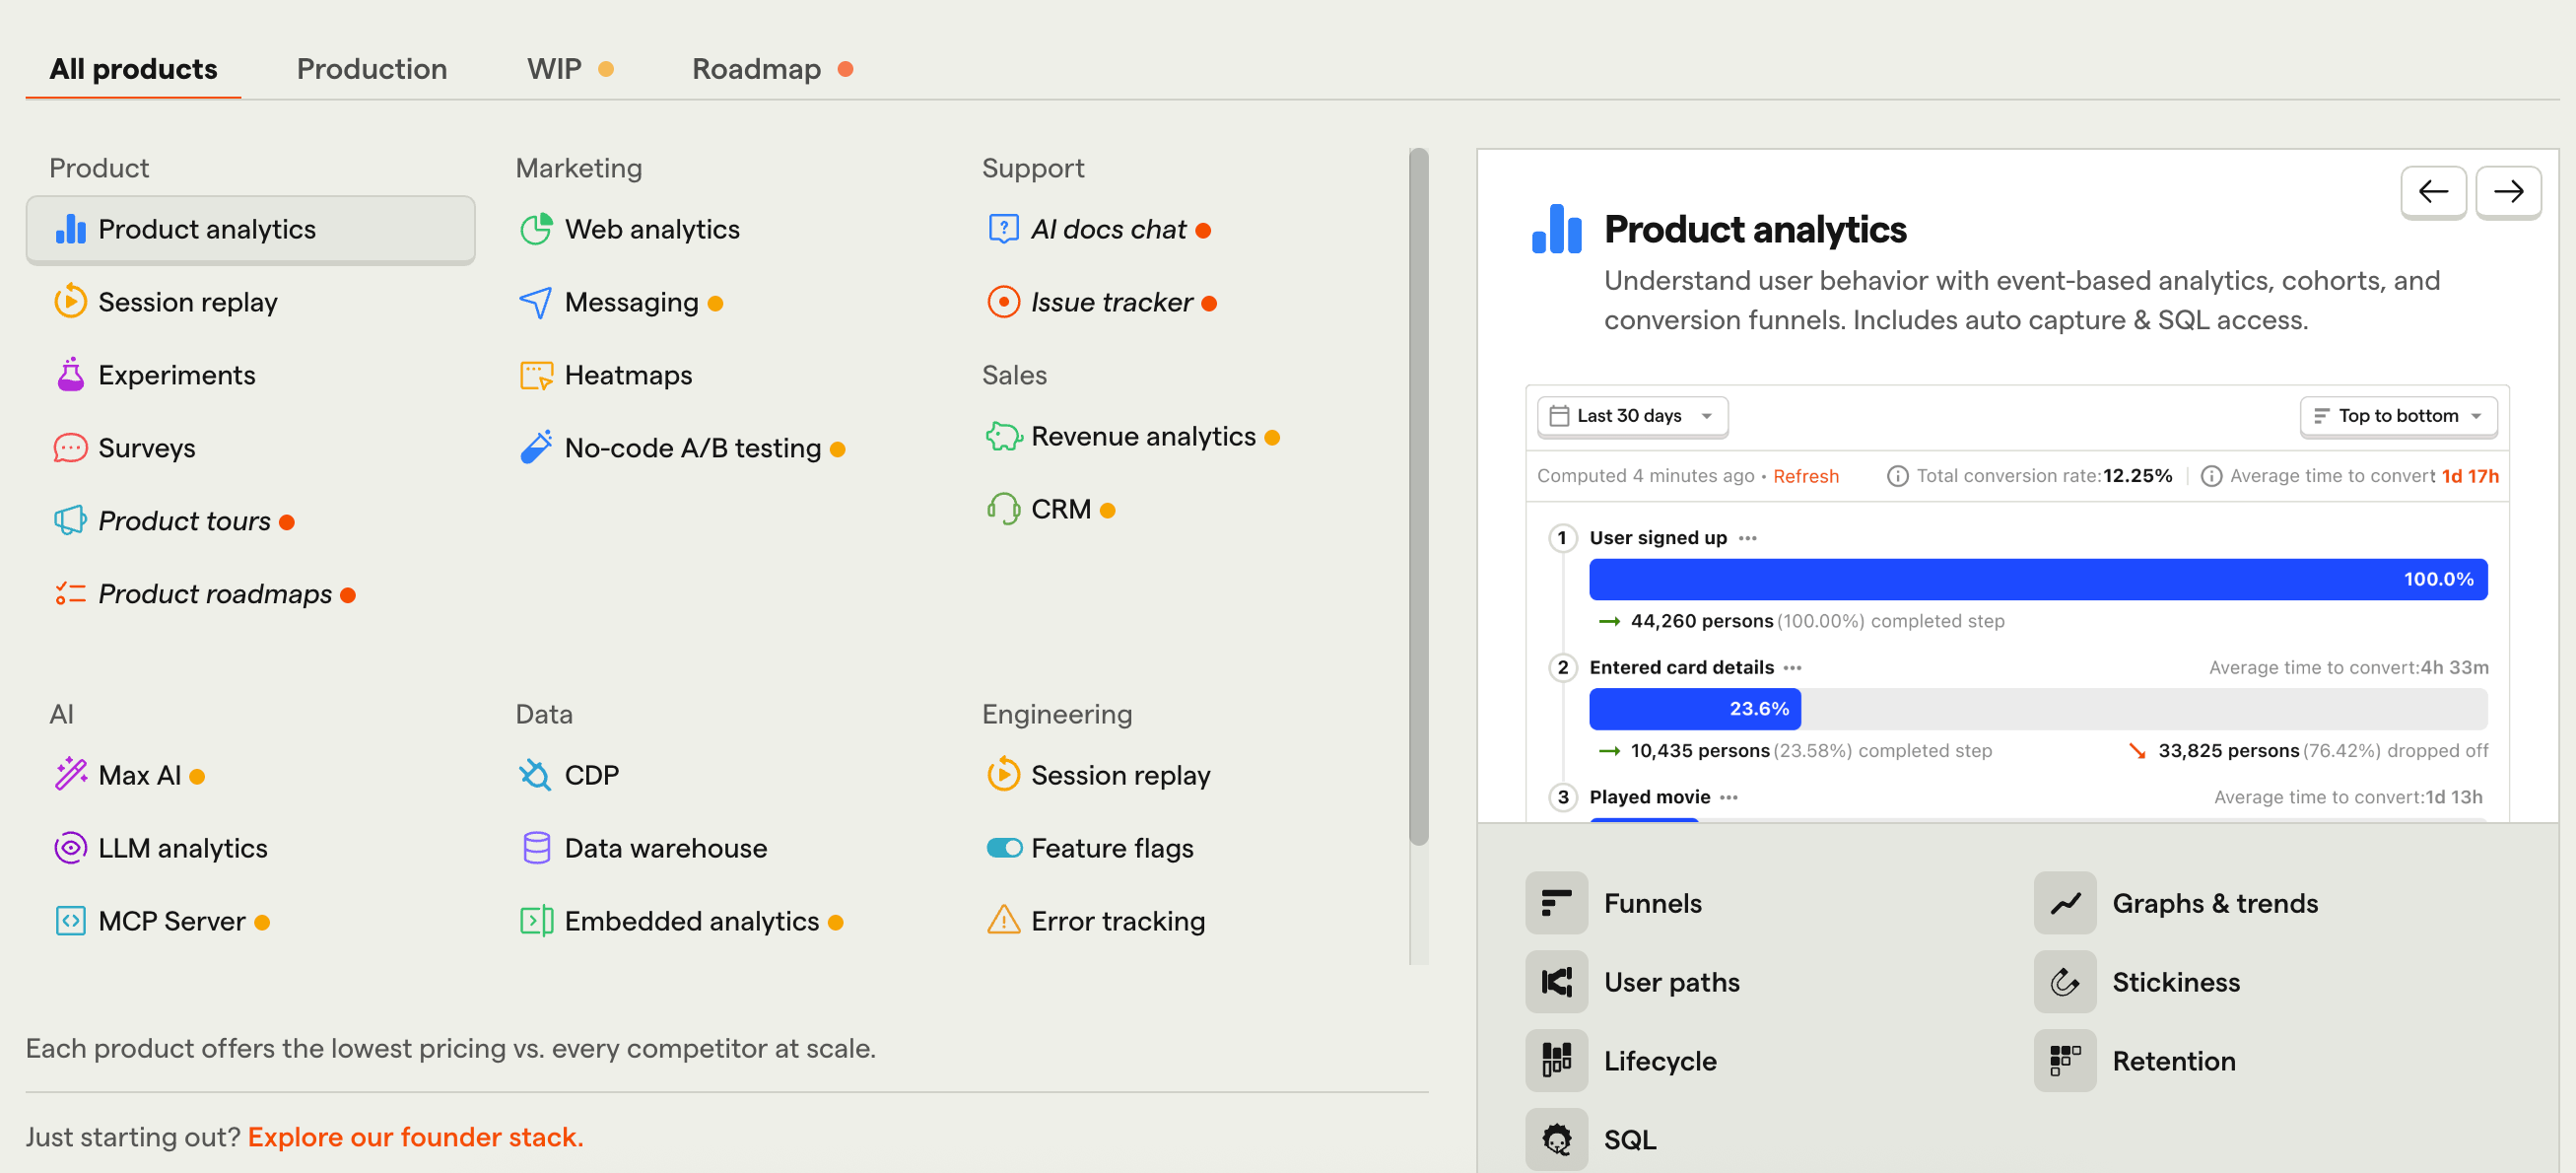
What is PostHog?
PostHog is an open-source product analytics suite with event tracking, funnels, cohorts, session replay, feature flags, and A/B tests. Ship it self-hosted for full data ownership or use the cloud. Capture web, mobile, and backend events with one SDK set.
Why is PostHog a top analytics & monitoring tool?
Self-host or cloud, PostHog unifies event tracking, session replay, and feature flags in one SDK for full data ownership, faster debugging, and clean A/B tests across web, mobile, and backend.
PostHog's top features
- Event capture and analytics: Collect web, mobile, and backend events via SDKs; autocapture clicks, page views, and form submissions; enrich events with properties and timestamps; query data with HogQL and build dashboards and trend reports.
- Funnels and conversion analysis: Define multi-step funnels from events, calculate step completion and drop-off, compare segments by user or event properties, and track changes over time.
- Cohorts and segmentation: Create dynamic cohorts based on behaviors, event sequences, and properties; reuse cohorts across analyses, dashboards, feature flags, and experiments.
- Session replay: Record and play back user sessions with DOM snapshots; inspect click paths, console logs, and network requests; configure masking and redaction for sensitive fields.
- Feature flags and experiments: Roll out features with targeting rules and percentage splits; assign users to A/B/n variants via flags; define outcome metrics from events and analyze variant performance.
💡 Summary: PostHog provides event collection, product analysis (funnels and cohorts), session replays, and controlled rollouts with experiments, all tied together through a single analytics workflow.
Pros and cons of PostHog
Pros: Why do people pick PostHog over other analytics & monitoring tools?
✅ Full data ownership
Self-host on your infra with PII masking and EU residency to meet strict compliance.
✅ Unified analytics, replays, and flags
One stack ties events, session replay, and feature flags for faster debugging and cleaner experiments.
Cons: What do people dislike about PostHog?
❌ Unpredictable usage costs
High event volumes and session replays can cause sharp, hard‑to‑forecast cloud bills.
❌ Operational overhead self‑hosting
ClickHouse, Kafka, and replay storage require ongoing infra tuning and DevOps ownership.
❌ Performance at scale
Complex queries and large funnels can lag vs Amplitude/Mixpanel on very large datasets.
Is there data to back PostHog as the best Analytics & Monitoring Tool?
4.6/5
avg customer rating on G2 & Capterra (2025), on par with or higher than Mixpanel/Amplitude
15k+
GitHub stars (open‑source traction), among the most‑starred product analytics platforms
10–100×
faster analytical queries via ClickHouse (PostHog’s engine) vs Postgres in published benchmarks
Pricing: How much does PostHog really cost?
PostHog uses a freemium, usage-based model with per-product pricing and tiered volume discounts; you pay only for what you use, and get generous free quotas every month.
Choose between these 2 billing models (with product-based add-ons):
- Free – $0, resets monthly, no credit card required; includes unlimited team members and tracked users, with generous quotas per product:
- 1 000 000 events (Analytics)
- 5 000 recordings (Session Replay)
- 1 000 000 feature-flag or experiment requests
- 100 000 exceptions (Error Tracking)
- 1 500 survey responses
- 1 000 000 rows (Data Warehouse)
- 100 000 events (LLM Analytics)
- Pay-as-you-go – Usage-based pricing across products, with tiered, step-down rates as volumes grow:
- Analytics events – starting at $0.00005/event after free tier, decreasing with volume
- Feature flags / Experiments – uses feature-flag request counts; per-product free tier then pay-as-you-go
- Session replay – first 5 000 recordings free; then $0.005/recording (lower at higher usage)
- Surveys – first 1 500 responses free; 1.5k–2k: $0.10/response; 2k–10k: $0.035; 10k–20k: $0.015; 20k+: $0.010
- Data pipelines / warehouse rows / LLM analytics / error events – all follow similar usage-based tiered pricing with generous free tier.
Price limitations & potential surprises
- Every product has its own free quota; exceeding any one triggers usage charges for that product independently.
- Usage is the sole cost driver, so team or user counts don’t impact billing.
- You can set monthly spend caps for each product to avoid unexpected overages, but PostHog stops processing usage for that product when its cap is reached, while others continue.
- Volume discounts kick in as usage grows (e.g., analytics: first 1 M free, next 1 M at $0.00005, remaining at $0.0000343, etc.; e.g., 12 M events ≈ $393/month).
Why consider Big Sur AI for analytics & monitoring that others miss
Big Sur AI uniquely combines advanced analytics with natively built, conversion-focused AI tools for web, sales, and content, letting you optimize user journeys and measure business impact in real time.
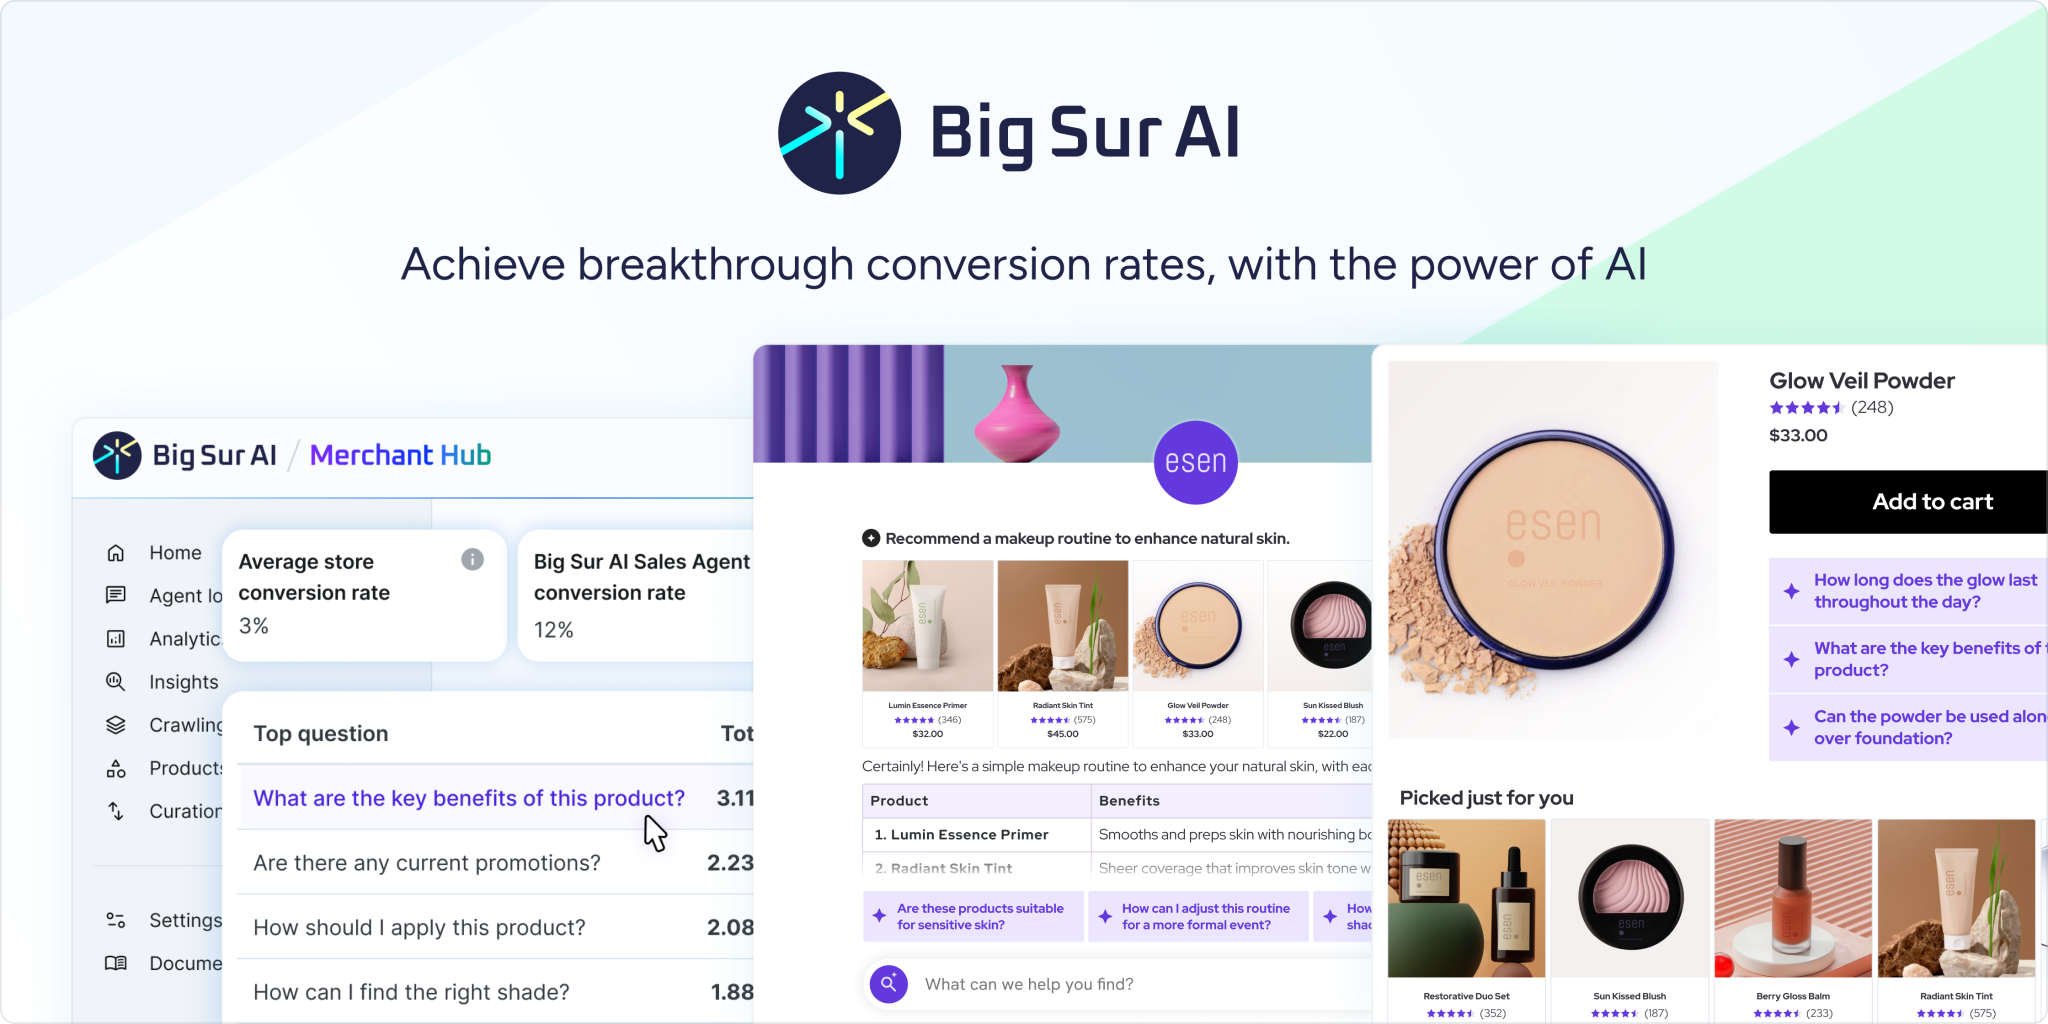
Consider Big Sur AI if you want to avoid bundling together typical chatbots or LLM monitoring stacks.
1. Deploy web-agents:
Deploy AI web agents, sales agents, and content marketers that not only engage users but also track, analyze, and optimize actual conversions and sales funnel outcomes.
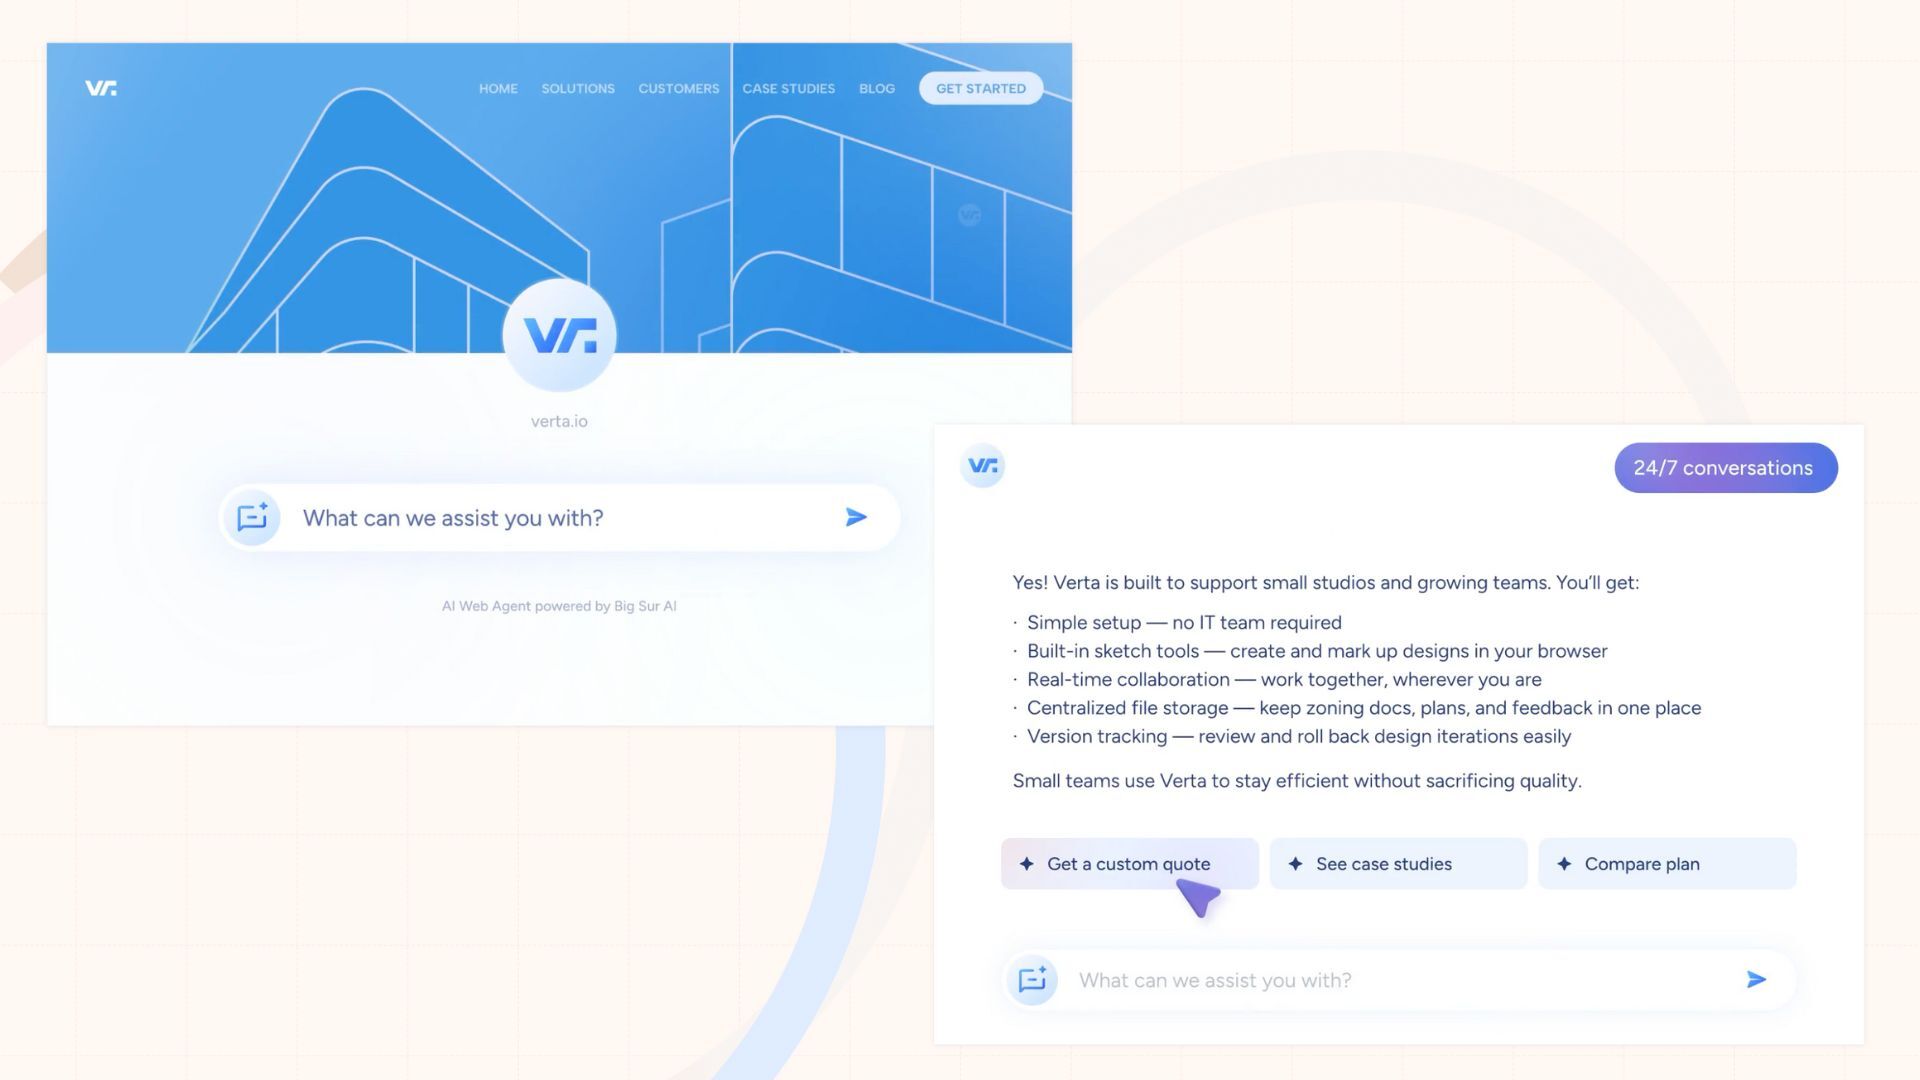
Example: The AI Sales Agent and Content Marketer connect user interactions directly to measurable business KPIs, tying analytics to revenue actions.
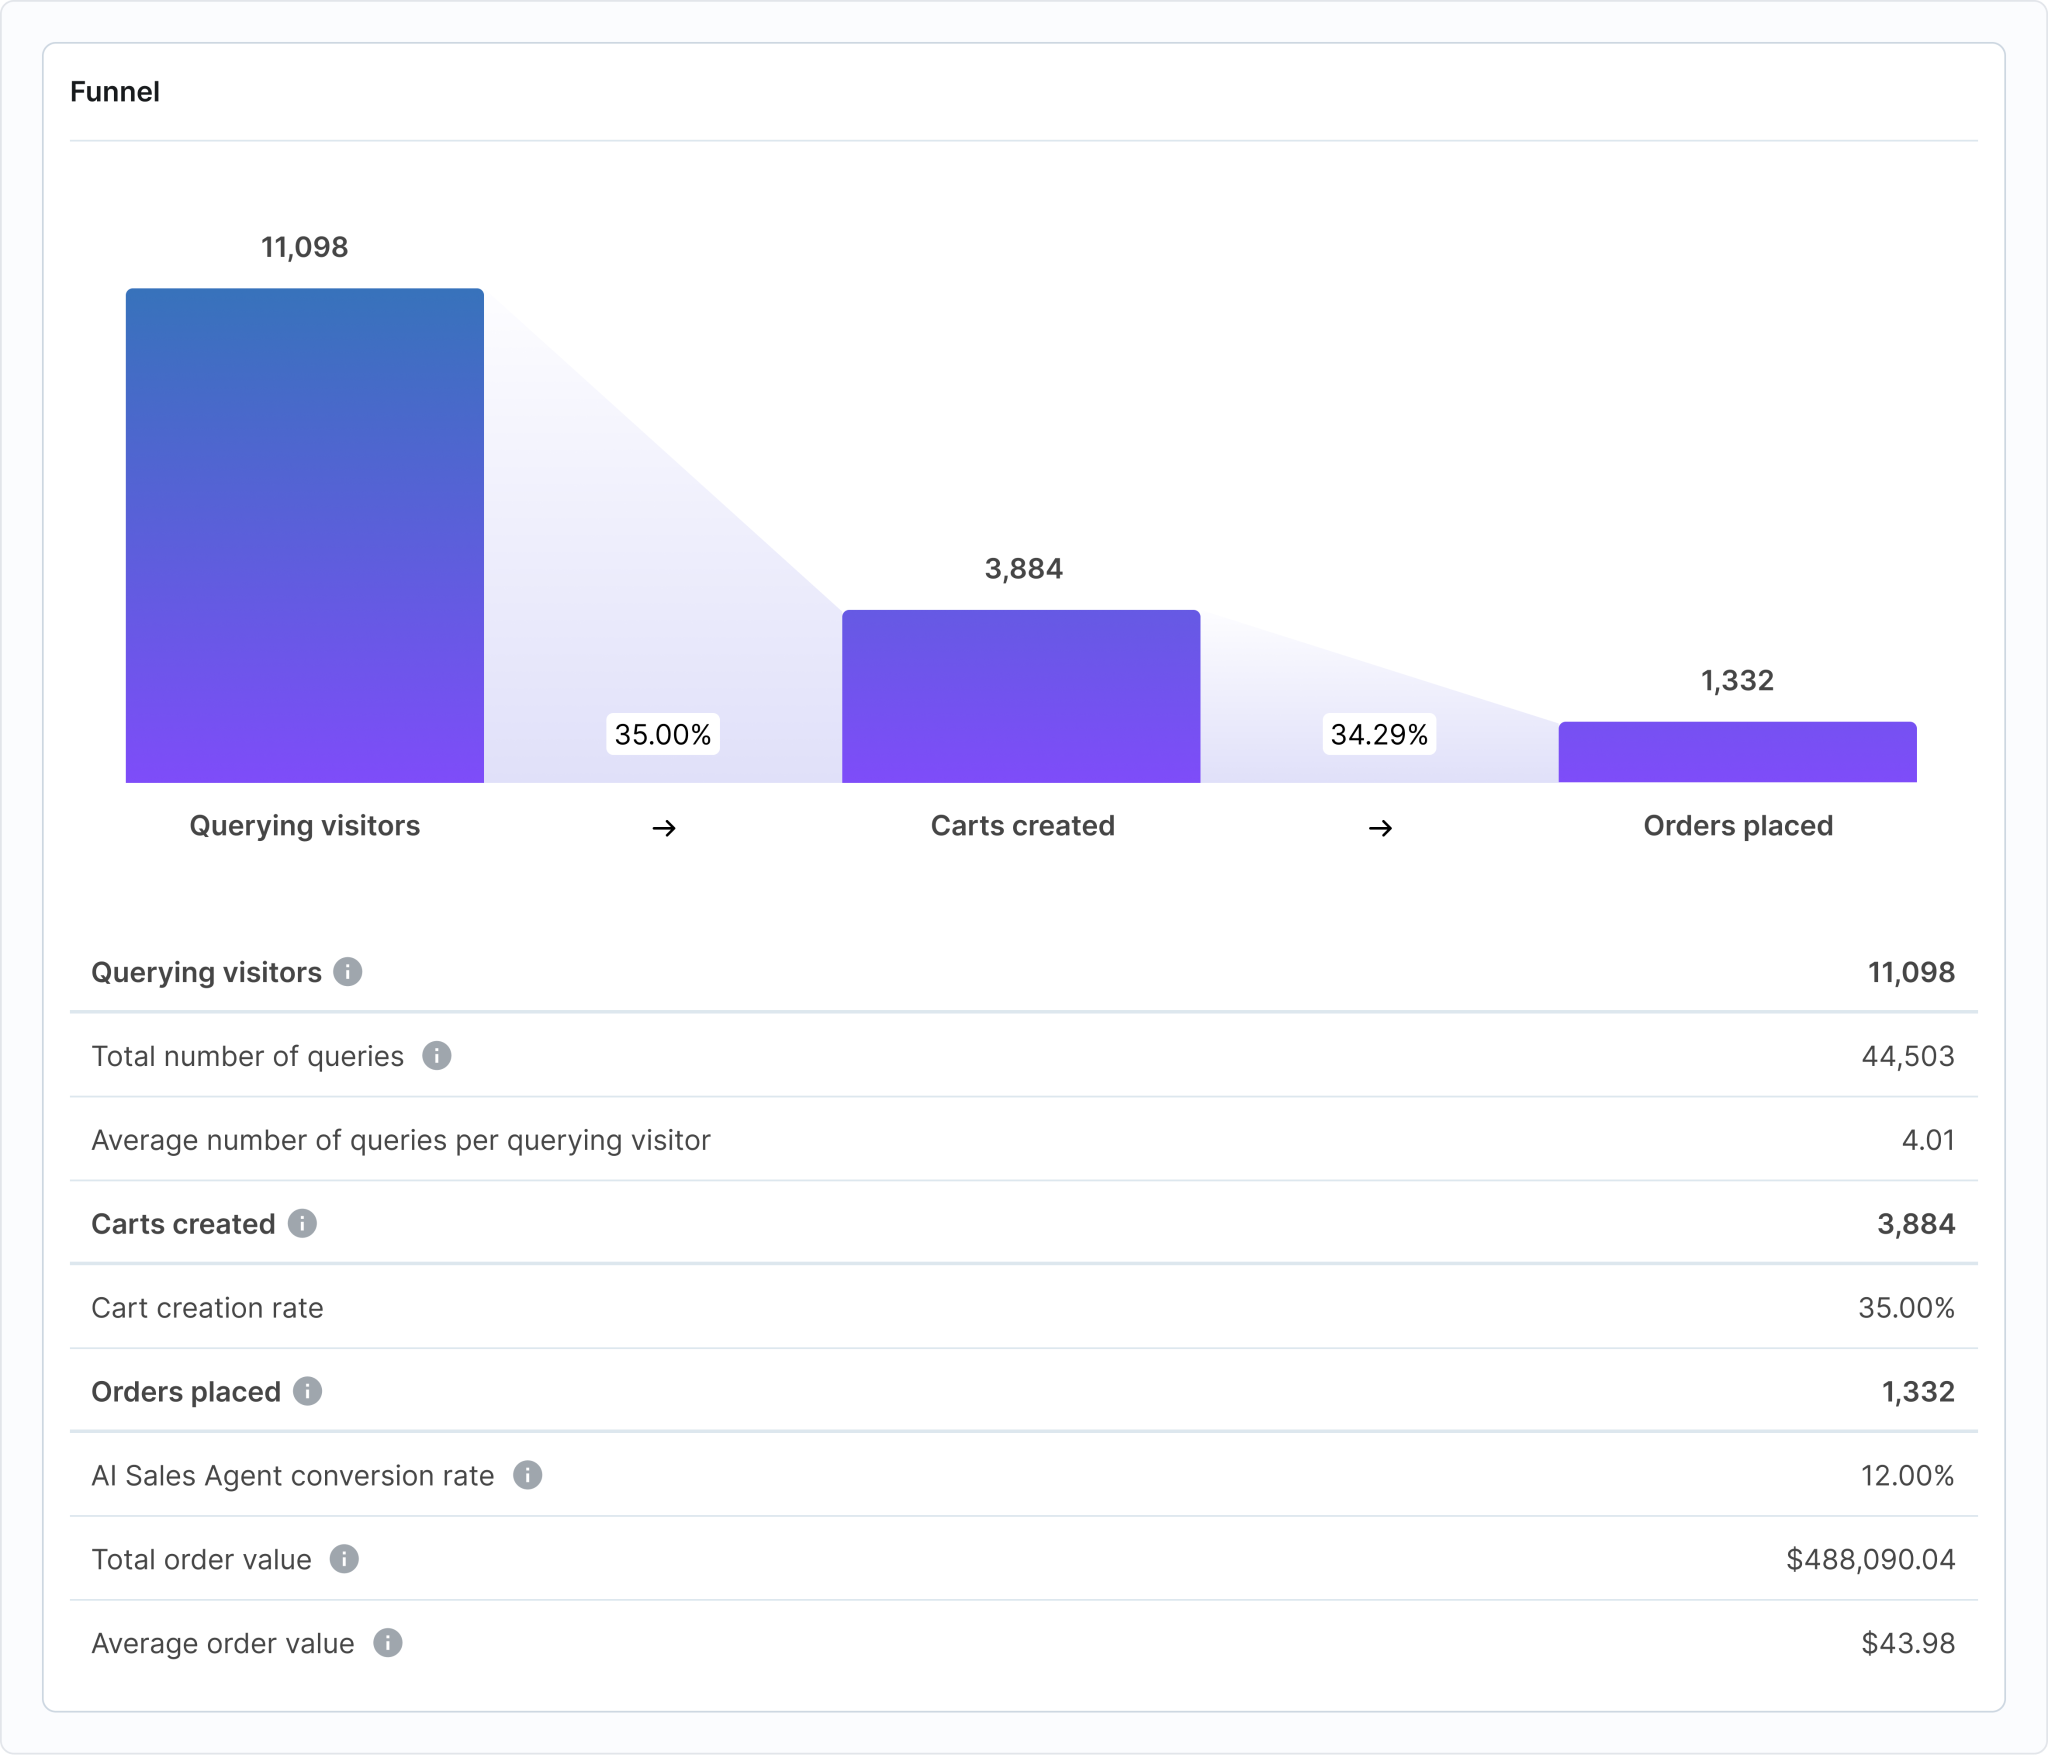
2. Merchant-focused, actionable insights unavailable elsewhere:
The Merchant Insights product aggregates AI-driven engagement, sales, and content performance into a single view for merchants and marketers.
It reports on what resonates, which prompts or products convert, and where users drop off, enabling fast, data-backed decisions, all built into the same platform as the AI agents themselves.
To experience analytics and optimization fully integrated with AI engagement, give Big Sur AI a try for free.
Which tool is best for your needs? (quick summary)
- If you care most about full-stack LLM/chatbot monitoring and experiment speed, pick Humanloop.
- If you need web or app product analytics with deep Google Ads integration (and free scale up to a point), choose Google Analytics 4.
- For granular product analytics, cohort insights, and growth tracking, Amplitude is your tool.
- If open-source, transparency, and customizable LLM monitoring matter most, Trulens wins out.
- Prefer self-hosting, direct data ownership, and an all-in-one suite (with session replay), go with PostHog.
Ready to get hands-on? Give Big Sur AI a try now and supercharge your LLM analytics and monitoring workflow.