10 CRO Metrics & KPIs You Should Track in 2025
Tracking the right CRO metrics is crucial to maximizing your website’s performance and marketing budget.
Analyzing KPIs such as conversion rate, bounce rate, and user behavior will let you optimize your website for more conversions.
In this article, we’ll review ten CRO metrics and KPIs you should focus on in 2024 to increase conversions, improve average revenue, and optimize the marketing funnel.
TL;DR
- Conversion rate optimization (CRO) metrics are important for online businesses. They provide actionable insights into user behavior and the customer buying funnel.
- Some core CRO metrics you should track and optimize include the conversion rate, average order value, and return on investment.
- Marketers are optimizing these metrics by bringing AI-powered tools to their websites to provide personalized product recommendations, automated email campaigns, and AI assistants.
Why CRO Metrics Are Important for Your Business in 2025
Conversion rate optimization metrics are important for online brands in 2025 as they provide actionable insights into user behavior, helping you identify improvement areas in the customer journey.
These metrics let you identify the effectiveness of your website’s buying funnel and marketing strategies by measuring how well you convert traffic into paying customers.
For example, online brands have been trying to determine how much results they get from AI-powered personalization efforts in e-commerce.
Statistics have estimated that personalization can yield up to 20% higher customer satisfaction and a 10-15% boost in conversion rates.
➡️ Conversion rate metrics include not only ‘’conversion rate’’, but also secondary metrics, such as lead conversion rate, mobile conversion rate, and average order value.
If you can track these metrics, your brand can make more data-driven decisions and maximize digital marketing performance.
CRO Metric #1: Conversion Rate
The #1 conversion rate optimization metric to follow and optimize for is the conversion rate (CR).
The conversion rate is the percentage of website visitors who completed a certain goal on your website, such as purchasing a product.
It is what people call ‘’the north star metric,’’ meaning that it’s the most crucial metric to track and optimize.
To measure conversion success, your brand must set up conversion tracking on Google Analytics or another software.
There are two kinds of conversions:
- Micro Conversions: Smaller goals you want your visitors to accomplish, such as adding a product to a cart or signing up for your newsletter.
- Macro Conversions: The final goals of your website, such as purchasing a product or signing up for paid coaching.
Online brands should also be interested in the conversion rates across devices.
For example, a significant difference exists between average conversion rates on desktops (3%) and mobile devices (1.6%).
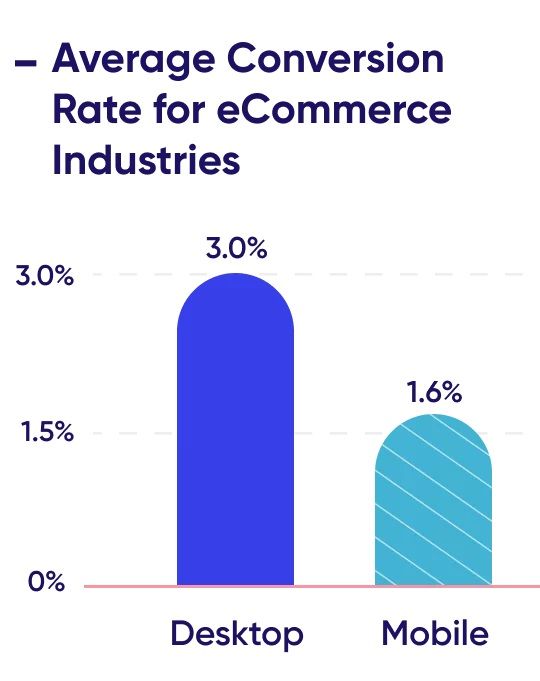
Research and image from Contentsquare.
💡According to CRO statistics, businesses that use conversion rate optimization tools see a 223% return on investment.
Here are the most common ways online brands optimize their conversion rates:
- A/B testing landing pages.
- Optimizing product pages with social proof, better imagery, and improved information architecture.
- Offering incentives like discounts, freemiums, or free trials to nudge consumers to consider converting.
- Setting up a conversational assistant in your store to answer complex customer questions.
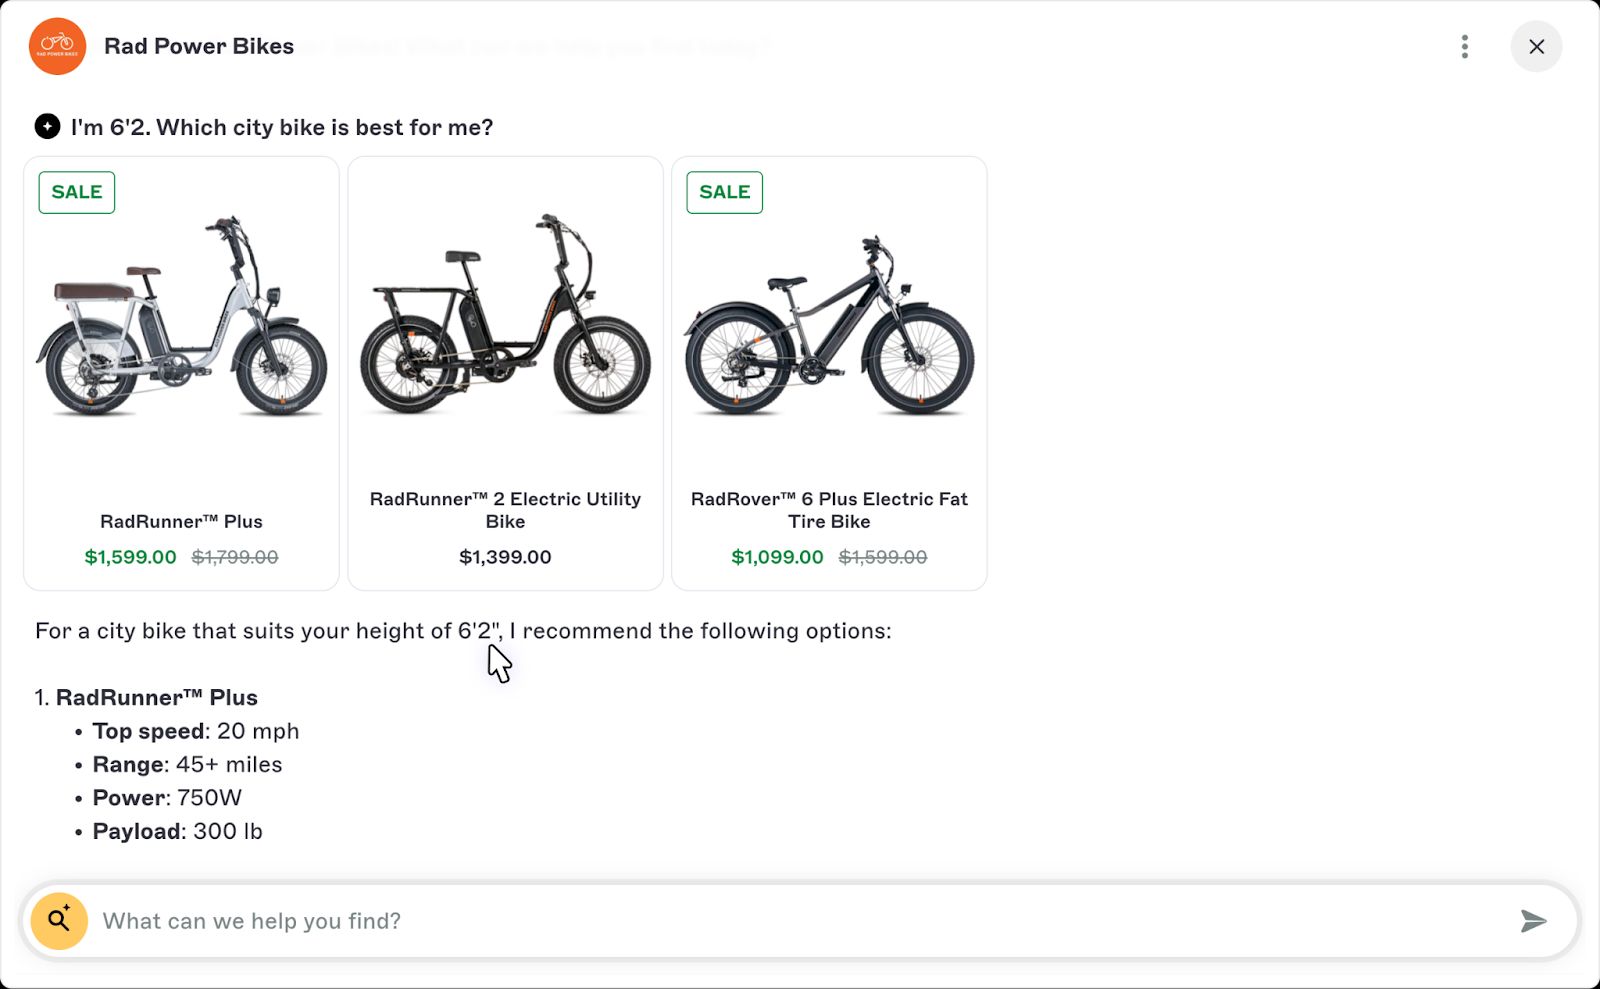
For example, Rad Power Bikes set up Big Sur AI’s Sales Agent (our tool) to increase their conversion rates.
The online retailer sells e-bikes, and most people have questions before deciding on the best bike for their needs.
Rad Power Bikes set up a conversational AI-powered assistant in their store to assist shoppers in comparing alternatives and answering complex queries.
For example, here’s the sales agent giving e-bike recommendations for the height of 6’2 ⤵️:
See the sales assistant in action ⤵️
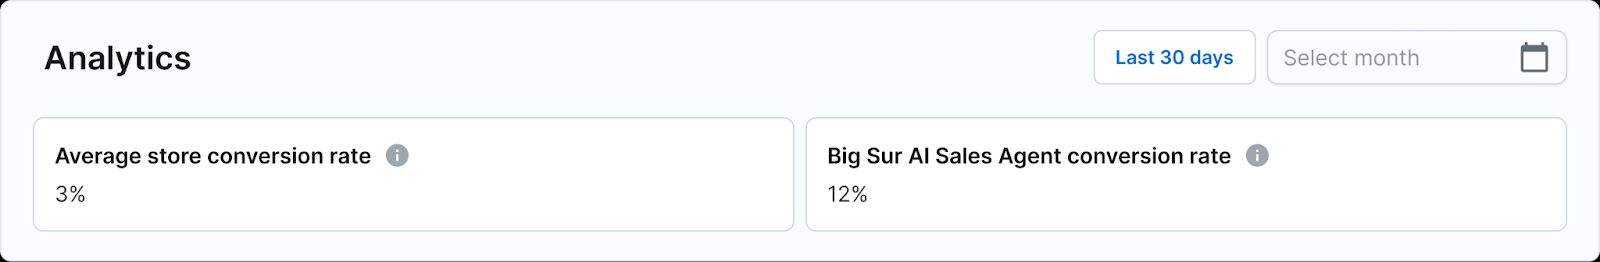
💡 Shoppers who interact with Big Sur AI Sales Agent convert at four times the rate of the average store user.
CRO Metric #2: Bounce Rate
The bounce rate measures the % of visitors that leave a landing page without interacting with it.
These visitors only visited 1 page, scrolled up and down, and left without performing any significant action.
Usually tracked inside Google Analytics or a similar platform, the bounce rate is a website engagement metric that you need to minimize to improve your visitor retention.
Bounce rates vary from industry to industry, as the average bounce rate can be up to 60% for non-e-commerce content.

Image and data from Backlinko.
➡️ A high bounce rate (80%+) can mean poor user experience or that the content might have been irrelevant to the readers.
If your landing pages have a higher bounce rate, the conversion rate will likely be smaller, meaning you need to improve it.
Here are some best practices for reducing bounce rates:
- For advertising: Improve your landing pages and audience targeting. It might be the case that you are showing these pages to the wrong people.
- For SEO: Look to increase the quality of your content and make it easy to take action, such as adding more internal links or CTAs.
- Optimize your page load times and mobile responsiveness, ensuring long loading times and mobile incompatibility are not why users bounce.
CRO Metric #3: Average Session Duration
The average session duration refers to the average time customers spend on your website during a single session.
This metric reflects on the quality of engagement with your site’s content. The longer the average sessions, the more likely customers would be interested in your product(s).
You can calculate this user engagement metric by dividing the total duration of all sessions by the number of sessions during a period.
For example, if there are 800 minutes of total duration on your website over 400 visitors, the average session duration would be 2 minutes.
You can view this metric already calculated in your Google Analytics account.
💡 Online brands should also be interested in the Average Time on Page metric, the average duration users spend on a specific page.
You can improve your site’s average session duration by:
- Adding video content on your landing pages that will make your customers stay on the page and watch them.
- Add interactive elements like quizzes, surveys, and a comment section to extend the session duration.
- Make your content easier to consume by adding bullet points, images, and infographics.
For example, Rad Power Bikes utilizes videos on their e-commerce product pages to keep consumers on the page longer.

The correlation between conversion rates and average session duration is that the longer you retain your customers on your website, the more likely you are to convert them.
A longer session duration implies that your customers engage with the content, potentially leading to micro or macro-conversions.
CRO Metric #4: Pages Per Session
Pages per session (PPS) measures the average number of pages a visitor views on your site.
This CRO metric gives your brand insights into how engaging and easy to navigate your website is, indicating whether customers are finding what they need.
➡️ A ‘’session’’ refers to the period during which a user interacts with a website, starting from when they land on the site and ending after a period of inactivity.
You can view and track this metric inside analytics software like Google Analytics.
The way it is calculated is that you have to divide the total page views by the total sessions.
For example, if your online store has 2,500 page views and 1,000 sessions, your average number of pages per session would be 2.5.
In other words, on average, a user views 2.5 pages during their visit.
Pages per session is an important metric because it shows the conversion potential of your online visitors.
If they are browsing through your website, they are actively researching your products and are interested in your offerings.
💡You can improve your site’s pages per session by:
- Internally linking your content so you can guide your users to other relevant content on your website.
- Improve the site navigation so your users can find what they want more easily.
- Add personalized product recommendations so your customers can view them.
For example, Wyze offers Big Sur AI’s product recommendation software to display personalized product recommendations on their product pages:

The brand has added ‘’Frequently Bought Together’’ and ‘’Picked just for you’’ product modules on their online store to increase its conversion rates.
This also allows them to increase the average number of pages users view per session.
CRO Metric #5: Cart Abandonment Rate
The Cart Abandonment Rate measures the percentage of customers who added products to their cart but left before buying.
Also known as checkout optimization, you can increase your e-commerce conversions by minimizing cart abandonments.
To calculate the cart abandonment rate, you have to divide the total number of completed purchases by the number of carts that were created, then subtract that number from 1 and multiply by 100.
For example, if you had 300 completed purchases last week, but customers created 1,000 carts during that time, your brand would have a cart abandonment rate of 70%.
The most common reasons for high cart abandonment rates are:
- The checkout process took too long.
- There was a general lack of payment options.
- The customers did not like the returns policy.
- The customers did not like the delivery cost or delivery time.
With high cart abandonment rates, your brand leaves money on the table.
Here are a few strategies to reduce cart abandonments:
- Set up ‘’win-back’’ email campaigns that retain the customers' email and send them a nudge to complete their purchase, sweetened by a discount.
- Offer a guest checkout that does not require them to input too much information, making the purchasing quicker.
- Be transparent about shipping costs, VAT, and returns up-front.
💡 Did you know personalized product recommendations can also improve cart abandonments by up to 4.35%?
This is because product recommendations increase consumer confidence that this product is for them, resulting in a lower chance of leaving the website.
CRO Metric #6: Customer Lifetime Value (CLTV)
Customer lifetime value (CLTV) measures the total revenue your brand has received from a single customer throughout your relationship.
It’s a metric aiming to maximize how much revenue you get from a single customer instead of getting new clients every time.
The customer lifetime value is calculated by multiplying the average purchase value by the number of transactions and by the customer lifespan.
➡️ For example, if a customer spends $200 per visit, shops ten times per year, and remains a client for five years, their CLV would be $200x10x5 = $10,000.
Or, if you are a software company, you identify that, on average, your clients remain on board for 12 months at an average plan of $100/month; your tool’s lifetime value would be $1,200.
This metric gives you insight into how well you are retaining your customers and the return on investment on any post-purchase efforts you do.
💡To improve that metric, your brand can:
- Improve the post-purchase customer experience with chatbots, product recommendations, and a good returns policy.
- Set up a loyalty or referral program that lets your customers get points and rewards for their loyalty to your brand.
- Hire a good customer support team that can assist your customers in resolving their problems quickly.
For example, online brands set up post-purchase chatbots like Zendesk to resolve customers’ problems.
You can equip your customer support with a unified platform where they can answer questions across email, web, and social media.
Zendesk’s AI chatbot can also answer common questions like return policy questions and how to use a product.
CRO Metric #7: Cost Per Acquisition (CPA)
Cost per acquisition (CPA) is a metric used in advertising that measures the total cost of acquiring a new paying customer.
The goal is to keep the CPA low so you can see a return on investment (ROI) from your paid marketing activities.
The metric is calculated by dividing the total costs of a marketing campaign by the number of conversions generated by that campaign.
➡️ For example, if you spend $10,000 on a PPC campaign in Google Ads that results in 500 new sales, your CPA would be $20 per customer.
You can track the cost per acquisition inside your advertising platform, such as Meta Ads, Google Ads, or TikTok Ads.
💡 Marketers are using CPA as a key metric so they know which campaigns to double down on (increase the marketing spend).
To improve the cost per acquisition for your advertising campaigns, you can consider the following:
- Optimizing your targeting across Meta and TikTok advertising.
- Experiment with different messaging and creatives to improve conversion rates (minimizing CPA).
- Testing out different landing pages to see which ones would perform better.
Another way to lower your CPA costs is to conduct more thorough market research, as 43.5% of marketers claim that market research has helped them gain insights into consumer needs and preferences.
For example, Lume Deororant optimized its Facebook Ads creatives and text by studying the pain points of its consumers.

The brand increased its click-through rates (how many people clicked on the ad) and subsequently lowered their CPA.
CRO Metric #8: Return on Investment (ROI)
Return on Investment (ROI) is a KPI measuring the profitability of a marketing campaign or software you have incorporated on your website.
It is a metric that helps you understand how much results you have gotten from your investment in any marketing activity to acquire more customers.
As the most important metric to measure, you can calculate it by dividing the Net Profit by the Cost of Investment, then multiplying it by 100 to get a %.
➡️ For example, if your brand invested $10,000 into an advertising campaign and got $30,000 in revenue, the net profit would be $20,000.
The ROI calculation, in that case, would be 200%.
Here are some of the best practices for improving your return on investment:
- Optimize your costs by investing in advertising, software, or services tied to your bottom line results.
- Track the performance of all marketing channels so you can double down on what brings the best return on ad spend.
- Cut back on campaigns and tools that are not returning your money’s worth.
💡For example, Big Sur AI’s pricing model lets you maximize your return on investment (ROI) by using our AI conversational assistant on your online store.
We offer a commission-based pricing model where you only pay when you get sales from the AI Sales Agent.
This is a pay-for-performance model, where merchants only pay a commission for each sale of their products attributed to our software.
The conversion window is negotiated, but it’s typically 30 days.

CRO Metric #9: Lead Conversion Rate
The lead conversion rate refers to the percentage of leads that convert into paying customers.
This metric is tracked and improved by B2B businesses, where they invest in better lead nurturing through the buying funnel.
It helps you track your closing rate of warm leads who already know about your brand and are interested in your services.
To calculate your lead conversion rate, divide the number of leads that become customers by the total number of leads, then multiply by 100.
➡️ For example, if your company generates 100 leads from a lead magnet and converts 10 of them into paying customers, then your lead conversion rate would be 10%.
Your lead conversion rate tells you about your prospects' drop-off points and is an important step in the conversion funnel.
💡 Here are some of the best ways to improve your lead conversion rate:
- Improve your lead nurturing by regularly contacting leads, following up on them, and educating them about your product.
- Make it easier to become a customer by minimizing the steps required to use your product.
- Offer more flexible pricing to help your customer make a smarter financial decision.
For example, StoreHub improved its lead conversion rates by 20% using a CRM like Hubspot.
The brand set up email automations and better lead tracking. They were able to create email templates for every interaction and situation with a prospect.
CRM software allows them to track the entire customer journey from start to finish and prioritize high-value leads.
CRO Metric #10: Average Order Value
Average order value (AOV) is an e-commerce CRO metric that measures the average amount of money each customer spends per transaction on your store.
You can calculate the AOV by dividing the total revenue by the number of orders.
➡️ For example, if your online store generated $10,000 of revenue from 500 orders, your AOV would be $20.
That means customers spend approximately $20 per order on your online site.
By improving your AOV, your brand can increase its revenue per customer, minimize cost per acquisition (CPA), and lead to a higher return on investment (ROI).
Some of the best practices for improving the AOV include:
- Implementing cross-selling and up-selling on your online store so you can encourage your customers to add complementary items to their baskets.
- Set free shipping thresholds that reward customers for filling up their baskets to be above a threshold (e.g., $100) to get free shipping.
- Personalizing the shopping experience by tailoring product recommendations to each shopper with the power of AI to increase their engagement and spending.
💡 Online stores like Wyze are increasing their average order values by incorporating AI-powered cross-selling and up-selling.
The AI technology analyzes shopper data to predict which products a customer might be interested in or what's already in their basket.
After that, the software generates sections in the product or category pages with recommended products.
For example, Big Sir's AI (that's us) can automatically generate:
- ''Picked for you'' product module that displays a selection of products your customers will most likely purchase.
- ''Frequently bought together'' product module that appears when a user adds a product to a cart.
- ''Top sellers'' product module that shows the best-selling product in the product category.
Wyze utilized Big Sur AI's cross-selling features to improve their average order value and conversion rate.

Cross-selling and upselling can take place on platforms other than the website.
You can set up personalized email recommendations (based on interactions on the website), in-app suggestions, or targeted advertisements.
Improve Your CRO Metrics With Big Sur AI
Increase your CRO metrics by bringing sales assistant-like conversations and AI product recommendations to your online store.
Our AI-powered Sales Agent can guide customers' buying journey with product suggestions, cross-selling, and upselling.
Be data-driven about what pre-purchase questions consumers have on your store to improve your product descriptions and customer journey.